Classbaze

Disclosure: when you buy through links on our site, we may earn an affiliate commission.

Data Visualization in Excel: All Excel Charts and Graphs

25+ Excel charts and graphs - Data Visualization in Microsoft Excel - visualizing data with Excel 2007- Excel 2019
4.1
4.1/5
(1,621 reviews)
143,645 students
Created by

9.0

Classbaze Grade®

9.7

Freshness

7.3

Popularity

9.3

Material

25+ Excel charts and graphs - Data Visualization in Microsoft Excel - visualizing data with Excel 2007- Excel 2019
Platform: Udemy
Video: 4h 14m
Language: English
Next start: On Demand

Best Excel Charts classes:

Classbaze Rating

Classbaze Grade®

9.0 / 10

CourseMarks Score® helps students to find the best classes. We aggregate 18 factors, including freshness, student feedback and content diversity.

Freshness

9.7 / 10
This course was last updated on 1/2022.

Course content can become outdated quite quickly. After analysing 71,530 courses, we found that the highest rated courses are updated every year. If a course has not been updated for more than 2 years, you should carefully evaluate the course before enrolling.

Popularity

7.3 / 10
We analyzed factors such as the rating (4.1/5) and the ratio between the number of reviews and the number of students, which is a great signal of student commitment.

New courses are hard to evaluate because there are no or just a few student ratings, but Student Feedback Score helps you find great courses even with fewer reviews.

Material

9.3 / 10
Video Score: 8.2 / 10
The course includes 4h 14m video content. Courses with more videos usually have a higher average rating. We have found that the sweet spot is 16 hours of video, which is long enough to teach a topic comprehensively, but not overwhelming. Courses over 16 hours of video gets the maximum score.
The average video length is 3 hours 20 minutes of 37 Excel Charts courses on Udemy.
Detail Score: 9.7 / 10

The top online course contains a detailed description of the course, what you will learn and also a detailed description about the instructor.

Extra Content Score: 10.0 / 10

Tests, exercises, articles and other resources help students to better understand and deepen their understanding of the topic.

This course contains:

12 articles.
47 resources.
0 exercise.
2 tests or quizzes.

In this page

About the course

What are the chart types I will learn in this course?
Excel offers the following major chart types. All of these are covered in this course
•    Column Chart
•    Line Chart
•    Pie Chart
•    Doughnut Chart
•    Bar Chart
•    Area Chart
•    XY (Scatter) Chart
•    Bubble Chart
•    Stock Chart
•    Surface Chart
•    Radar Chart
•    Combo Chart
•    Pivot Chart
•    Sparklines
And many other creative ones 🙂

How are charts useful in Excel?
A chart is a tool you can use in Excel to communicate data graphically. Charts allow your audience to see the meaning behind the numbers, and they make showing comparisons and trends much easier.

What are the benefits of using charts in Excel?
Excel charts allow spreadsheet administrators to create visualizations of data sets. By highlighting a set of data within an Excel spreadsheet and feeding it into the charting tool, users can easily create various types of charts in which the data is displayed in a graphical way.

This course will answer all the questions that would pop up while you set to visualize your data using Excel charts such as:
How do you make Excel charts look better?
How do you format a chart in Excel?
What are the different elements of charts?
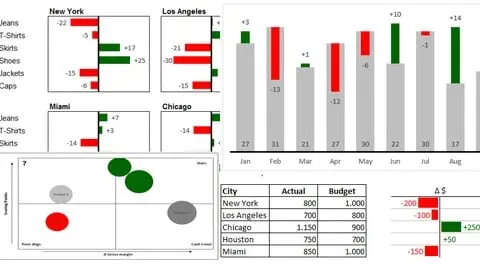
How do I make those awesome infographics that I see in fancy magazines and TV reports?
How do I create a comparison chart in Excel?
What is the best chart to use for comparison?
And many more…

How is this course different from other resources available online?
Most courses cover only teach how to draw different types of charts in Excel. The main point is missed. The main point of creating a chart is that you want to convey a message or tell a story using the chart. In this course, once you have learnt all the charting tools, you will also learn how you should create a chart. How you can highlight your message and avoid clutter in the chart, so that when your audience looks at the chart, the message is clearly conveyed to them.

What can you learn from this course?

✓ Learn the techniques to communicate clear and concise message through your charts
✓ Learn how to create 25+ chart types in Excel
✓ Learn by Doing. Course comes with numerous exerises sheets to practice learnt concepts
✓ Master the art of creating impactful Excel charts
✓ Get familiar with all the elements of charts in Excel
✓ Become proficient in using powerful tools such as pivot tables and pivot charts
✓ Master newly introduced chart types such as sunburst, treemap and waterfall chart
✓ Learn how to create cool infographics to represent data

What you need to start the course?

• You will need a PC with any version of Excel installed in it
• Basic understanding of Excel operations like opening, closing and saving a file

Who is this course is made for?

• Anyone curious to master charts in excel from beginner to advanced in short span of time

Are there coupons or discounts for Data Visualization in Excel: All Excel Charts and Graphs ? What is the current price?

The course costs $14.99. And currently there is a 25% discount on the original price of the course, which was $19.99. So you save $5 if you enroll the course now.
The average price is $14.8 of 37 Excel Charts courses. So this course is 1% more expensive than the average Excel Charts course on Udemy.

Will I be refunded if I'm not satisfied with the Data Visualization in Excel: All Excel Charts and Graphs course?

YES, Data Visualization in Excel: All Excel Charts and Graphs has a 30-day money back guarantee. The 30-day refund policy is designed to allow students to study without risk.

Are there any financial aid for this course?

Currently we could not find a scholarship for the Data Visualization in Excel: All Excel Charts and Graphs course, but there is a $5 discount from the original price ($19.99). So the current price is just $14.99.

Who will teach this course? Can I trust Start-Tech Academy?

Start-Tech Academy has created 45 courses that got 65,620 reviews which are generally positive. Start-Tech Academy has taught 1,454,873 students and received a 4.4 average review out of 65,620 reviews. Depending on the information available, we think that Start-Tech Academy is an instructor that you can trust.
3,000,000+ Enrollments | 4+ Rated | 160+ Countries
Start-Tech Academy is a technology-based Analytics Education Company and aims at Bringing Together the analytics companies and interested Learners. Our top quality training content along with internships and project opportunities helps students in launching their Analytics journey. 
Founded by Abhishek Bansal and Pukhraj Parikh.
Working as a Project manager in an Analytics consulting firm, Pukhraj has multiple years of experience working on analytics tools and software. He is competent in  MS office suites, Cloud computing, SQL, Tableau, SAS, Google analytics and Python.
Abhishek worked as an Acquisition Process owner in a leading telecom company before moving on to learning and teaching technologies like Machine Learning and Artificial Intelligence.

Browse all courses by on Classbaze.

9.0

Classbaze Grade®

9.7

Freshness

7.3

Popularity

9.3

Material

Platform: Udemy
Video: 4h 14m
Language: English
Next start: On Demand

Classbaze recommendations for you