Classbaze

Disclosure: when you buy through links on our site, we may earn an affiliate commission.

Excel with Interactive Excel Dashboards

Learn how to create amazing interactive Excel Dashboards that will wow your boss & take your career to the next level. Lifetime access with no subscription on Udemy.
4.6
4.6/5
(840 reviews)
7,804 students
Created by

9.6

Classbaze Grade®

9.8

Freshness

8.8

Popularity

9.7

Material

Learn how to create amazing interactive Excel Dashboards that will wow your boss & take your career to the next level. Lifetime access with no subscription on Udemy.
Platform: Udemy
Video: 12h 24m
Language: English
Next start: On Demand

Best Excel Dashboard classes:

Classbaze Rating

Classbaze Grade®

9.6 / 10

CourseMarks Score® helps students to find the best classes. We aggregate 18 factors, including freshness, student feedback and content diversity.

Freshness

9.8 / 10
This course was last updated on 2/2022.

Course content can become outdated quite quickly. After analysing 71,530 courses, we found that the highest rated courses are updated every year. If a course has not been updated for more than 2 years, you should carefully evaluate the course before enrolling.

Popularity

8.8 / 10
We analyzed factors such as the rating (4.6/5) and the ratio between the number of reviews and the number of students, which is a great signal of student commitment.

New courses are hard to evaluate because there are no or just a few student ratings, but Student Feedback Score helps you find great courses even with fewer reviews.

Material

9.7 / 10
Video Score: 9.5 / 10
The course includes 12h 24m video content. Courses with more videos usually have a higher average rating. We have found that the sweet spot is 16 hours of video, which is long enough to teach a topic comprehensively, but not overwhelming. Courses over 16 hours of video gets the maximum score.
The average video length is 4 hours 42 minutes of 60 Excel Dashboard courses on Udemy.
Detail Score: 10.0 / 10

The top online course contains a detailed description of the course, what you will learn and also a detailed description about the instructor.

Extra Content Score: 9.5 / 10

Tests, exercises, articles and other resources help students to better understand and deepen their understanding of the topic.

This course contains:

0 article.
2 resources.
0 exercise.
0 test.

In this page

About the course

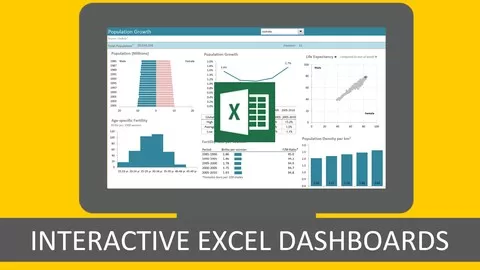
Excel Dashboards are a powerful tool to communicate and summarize complex Excel data.
The price of this course reflects its value and I’m confident you’ll get results. Just read some of the unsolicited testimonials I’ve received:
•”Financial Analyst – $52,500 (before taking your course) • Sr. Financial Analyst – ($60,000) After finalizing my dashboard• Sr. Business Analyst – ($70,000) Start that this MondayTaking your course has honed my skills and led to two promotions and a reputation. I am also energized to learn more. James C”
“I originally signed up for this as continuing professional education for my CPA license but I have learned so much, easily more than any other technical class I’ve taken in years. Thank you for a wonderful class, you are a great teacher. Dielle B”
Dashboards can be created to summarize important information and are excellent for sharing a “snapshot” view among teams.
Master the Creation of Interactive Excel Dashboards and Learn to Build and Distribute Dashboard Reports From the Ground up.
•Advanced Features •Design and Display Principles •Interactive Controls •Analyzing Data •Automating your Dashboard so it updates in seconds Impressive Content that Will Provide Insight, Analysis and Alerts Dashboards are fully interactive and dynamic and can help with project management, customer service, retail management, financial forecasting and much more.
In order to learn Excel Dashboard students should have access to Excel 2007 or later. Students should also be familiar with putting together any type of report in Excel to be able to apply the time saving and visualization techniques taught here. Students should be able to build and apply basic formulas in Excel as well. Pivot Table and Pivot Chart knowledge is helpful, but expertise is not necessary to take this course.
Contents and Overview This course includes 107 lectures and over 11 hours of content + 5 sample Excel Dashboards in order to give students a working knowledge of utilizing Excel Dashboard visuals to communicate their data.
3 hours of the tutorials are optional supplementary Excel lessons and only for students who need to fill any knowledge gaps.I don’t waffle on, my tutorials get to the point so you’re up to speed fast.
Included are all the workbooks from the course which contain extensive notes, so you don’t have to worry about taking notes while watching the tutorials. You can use the workbooks to practice what you learn and as a quick reference guide later on.
The course covers advanced features of Excel Dashboards, such as display and visualization principles for clear dashboard creation, using interactive controls to keep information informative and relevant, analyzing and automating information for a fully functional and complete dashboard. It also includes key considerations for distributing dashboards like password protections, locking and unlocking cells and protecting workbooks.
Upon completion, students will have a variety of techniques and examples that can be applied to their own datasets. Students will be able to choose the right chart for their data, write easy to interpret reports, know which areas of the dashboard will get the most attention, animate charts using VBA, create interactive reports (so users can change views and filter information), among a host of other abilities taught in this course.

What can you learn from this course?

✓ I teach you the 5 key questions to ask in the planning stage of your report so you get it right first time.
✓ Learn how to choose the right chart for your data; I teach you over 20 charts and show you which type of chart will best display your data.
✓ Learn how to write reports that are easy to read and interpret; plus I share with you a heat map of your page that shows you where your most important data should go and where will get the least attention.
✓ Be able to build Dashboards that are quick and easy to update, in fact they can update themselves (imagine being able to confidently say that in an interview), by pulling in data direct from your external database, Microsoft Access, the web etc. at the click of a button if you set them up right (I show you how).
✓ Animate your charts with some simple VBA code that I teach you how to edit to suit your charts. If you want ‘Wow factor’, this is it.
✓ Learn how to create reports that are fully interactive so the reader can change the view themselves; they can filter by product, time period or any parameter you choose, they can show and hide data using check boxes, drop down lists, and option buttons to name a few.
✓ Get your skills up to date with our supplementary Excel tutorials on PivotTables, Lookup and conditional logic formulas, macros and more.

What you need to start the course?

• Ideally you already know how to use Excel and are familiar with basic formulas and how to build them. You’ve created basic charts using the standard ones available in Excel, and you’re familiar with Pivot Tables and Pivot Charts but not an expert.
• You need Excel 2007 or later so you can open the workbooks and practice what you learn.
• Mac users – this course is recorded in Excel for the PC. If you’re a savvy Mac user then you will still benefit from this course and be able to map the menus you see in the tutorials to those on your Mac. I have had many Mac users successfully take this course.

Who is this course is made for?

• This course is not for complete beginners because building Dashboards, and I mean proper interactive dashboards in Excel, requires some intermediate to advanced skills.
• Any course that says it’s for ‘All Levels’ is either going to cover a load of basics you probably already know, or it won’t get to the advanced topics that are going to make your dashboards truly dynamic and interactive.
• I know everyone is at different levels of Excel ability, which is why I’ve included a load of optional supplementary Excel lessons so you can fill in any knowledge gaps, like PivotTables, lookup formulas, Conditional Formatting etc.
• I recommend this course for people who have put together any type of report in Excel before, as you will definitely benefit from the time saving tips and data visualisation techniques I share with you.

Are there coupons or discounts for Excel with Interactive Excel Dashboards ? What is the current price?

The course costs $199.99. And currently there is a -600 discount on the original price of the course, which was $124.99. So you save $-75 if you enroll the course now.
The average price is $19.4 of 60 Excel Dashboard courses. So this course is 931% more expensive than the average Excel Dashboard course on Udemy.

Will I be refunded if I'm not satisfied with the Excel with Interactive Excel Dashboards course?

YES, Excel with Interactive Excel Dashboards has a 30-day money back guarantee. The 30-day refund policy is designed to allow students to study without risk.

Are there any financial aid for this course?

Currently we could not find a scholarship for the Excel with Interactive Excel Dashboards course, but there is a $-75 discount from the original price ($124.99). So the current price is just $199.99.

Who will teach this course? Can I trust Mynda Treacy?

Mynda Treacy has created 2 courses that got 14,394 reviews which are generally positive. Mynda Treacy has taught 149,545 students and received a 4.6 average review out of 14,394 reviews. Depending on the information available, we think that Mynda Treacy is an instructor that you can trust.
Microsoft Excel MVP, Teaching 100,000+ Students
Browse all courses by on Classbaze.

9.6

Classbaze Grade®

9.8

Freshness

8.8

Popularity

9.7

Material

Platform: Udemy
Video: 12h 24m
Language: English
Next start: On Demand

Classbaze recommendations for you