Classbaze

Disclosure: when you buy through links on our site, we may earn an affiliate commission.

Certification in Kagi (TA) Charts & Smiling Buddha Strategy

Kagi Chart reading is a Advance Stock Trading skill. Learn My Secret (Smiling Buddha) Strategy for Stock Trading as well
5.0
5.0/5
(92 reviews)
8,369 students
Created by

9.6

Classbaze Grade®

10.0

Freshness

9.1

Popularity

9.1

Material

Kagi Chart reading is a Advance Stock Trading skill. Learn My Secret (Smiling Buddha) Strategy for Stock Trading as well
Platform: Udemy
Video: 1h 9m
Language: English
Next start: On Demand

Best Financial Trading classes:

Classbaze Rating

Classbaze Grade®

9.6 / 10

CourseMarks Score® helps students to find the best classes. We aggregate 18 factors, including freshness, student feedback and content diversity.

Freshness

10.0 / 10
This course was last updated on 6/2022.

Course content can become outdated quite quickly. After analysing 71,530 courses, we found that the highest rated courses are updated every year. If a course has not been updated for more than 2 years, you should carefully evaluate the course before enrolling.

Popularity

9.1 / 10
We analyzed factors such as the rating (5.0/5) and the ratio between the number of reviews and the number of students, which is a great signal of student commitment.

New courses are hard to evaluate because there are no or just a few student ratings, but Student Feedback Score helps you find great courses even with fewer reviews.

Material

9.1 / 10
Video Score: 7.7 / 10
The course includes 1h 9m video content. Courses with more videos usually have a higher average rating. We have found that the sweet spot is 16 hours of video, which is long enough to teach a topic comprehensively, but not overwhelming. Courses over 16 hours of video gets the maximum score.
The average video length is 3 hours 15 minutes of 154 Financial Trading courses on Udemy.
Detail Score: 9.8 / 10

The top online course contains a detailed description of the course, what you will learn and also a detailed description about the instructor.

Extra Content Score: 9.9 / 10

Tests, exercises, articles and other resources help students to better understand and deepen their understanding of the topic.

This course contains:

3 articles.
0 resource.
0 exercise.
1 tests or quizzes.

In this page

About the course

*** Course access includes quizzes & homework exercises, 1-on-1 instructor support and LIFETIME access! ***
Hear why this is one of the TOP-NOTCH Technical Analysis Course on Udemy:
Very interesting and unique technical analysis course which will help to make decisions. The instructor clearly explains how to achieve and what to be done.
-Hari Kishan
This is a concise course on the benefits of using Kagi charts as a positional trading confirmation tool. I learned a useful skill here.
-Natraj Jayaraman
Its a very new concept of charting/trading to me, but it looms absolutely interesting
-Michael Rowland
TOP-NOTCH Technical Analysis & Stock Trading Instructor
I currently have 71 Knowledge programs with 20,520+ Minutes of Content (342 hours in total) with 112,000+ Satisfied Students enrolled. That’s 14+ days of learning material!
I am currently mentioned in “Most Popular Instructors” tab on Udemy Business/Finance Section.
Technical Analysis & Stock Trading Course Details:
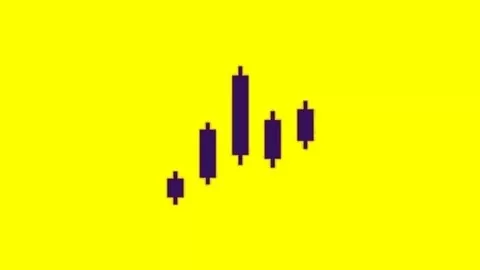
Kagi chart is a chart used for Following Price Trends and to make decisions According to long term trends in Stock Trading . Kagi Chart differs from traditional Stock Trading charts Example Candlestick chart as Kagi is independent of time.
Kagi charts were invented in the late 19th century in Japan for Trading Rice and was extremely Successful.
You cannot become a Expert Certified Financial Technician without learning Kagi charts.
Therefore this is your chance to learn a new Technical Analysis Skill. Kagi chart is a skill only used by Professionals & Now its your time to learn.
This Technical Analysis Course comes with a 30 day money back guarantee.
The Kagi chart is a chart used for tracking price movements and to make decisions regarding Buying or selling of stocks. It differs from traditional stock charts such as the Candlestick chart by being mostly independent of time. 
This feature helps in producing a chart that reduces random Price noise.
Make Stock Market your darling and you will never see losses.
This course will teach you How Stock Trading Works & How to become a stock trading expert.
Disclaimer Note: This Technical Analysis & Stock Trading course is for educational and informational purposes only. Not recommending of any particular investments such as a particular stock or mutual fund.

What can you learn from this course?

✓ Master Advance Technical Analysis Chart like Kagi in terms of Stock Market
✓ Master Smiling Buddha Stock Trading Strategy in terms of Kagi Chart
✓ Understanding Kagi Charts Like a Professional Technical Analyst
✓ Learn Kagi Chart from all Stock Trading Angles
✓ Use little-known techniques to greatly reduce risk and maximize profits
✓ Learn How is Kagi Chart Made?

What you need to start the course?

• No prior trading experience is necessary
• You will need a practice Trading Account
• Open Mind and not judging the Strategy from past learning
• You commit that after the course you will do demo trading on this strategy for at-least 6 Months.

Who is this course is made for?

• Anyone interested in earning an extra income from home
• You should not take this course if you aren’t willing to dedicate some time and discipline to learning the strategy

Are there coupons or discounts for Certification in Kagi (TA) Charts & Smiling Buddha Strategy ? What is the current price?

The course costs $14.99. And currently there is a 82% discount on the original price of the course, which was $84.99. So you save $70 if you enroll the course now.
The average price is $26.9 of 154 Financial Trading courses. So this course is 44% cheaper than the average Financial Trading course on Udemy.

Will I be refunded if I'm not satisfied with the Certification in Kagi (TA) Charts & Smiling Buddha Strategy course?

YES, Certification in Kagi (TA) Charts & Smiling Buddha Strategy has a 30-day money back guarantee. The 30-day refund policy is designed to allow students to study without risk.

Are there any financial aid for this course?

Currently we could not find a scholarship for the Certification in Kagi (TA) Charts & Smiling Buddha Strategy course, but there is a $70 discount from the original price ($84.99). So the current price is just $14.99.

Who will teach this course? Can I trust Saad T. Hameed (STH)?

Saad T. Hameed (STH) has created 59 courses that got 7,006 reviews which are generally positive. Saad T. Hameed (STH) has taught 238,727 students and received a 4.5 average review out of 7,006 reviews. Depending on the information available, we think that Saad T. Hameed (STH) is an instructor that you can trust.
Stock Trading, Options Trading, Investing in Binary & Crypto
Most of my premium courses have recently earned the best-selling status for outstanding performance and student satisfaction.
I currently have 71 Knowledge programs with 20,520+ Minutes of Content (342 hours in total) with 310,000+ Satisfied Students Worldwide enrolled. That’s 14+ days of learning material!
I am a Financial Trader who learned the hard way. I have a strong focus on Financial markets and investments strategies. 
I am teaching so that others know what is the difference between them and Hedge fund or high network traders and how to become one. If even one person through my Courses becomes a successful person then I have achieved an important milestone.
Now a days I am learning & teaching other skills that help my investment Students to expand.
Browse all courses by on Classbaze.

9.6

Classbaze Grade®

10.0

Freshness

9.1

Popularity

9.1

Material

Platform: Udemy
Video: 1h 9m
Language: English
Next start: On Demand

Classbaze recommendations for you