Classbaze

Disclosure: when you buy through links on our site, we may earn an affiliate commission.

Comprehensive Graphics Visualizations with R

Learn the important features of the base, ggplot and lattice ("trellis") graphical capabilities in R
4.1
4.1/5
(73 reviews)
2,025 students
Created by

8.4

Classbaze Grade®

8.0

Freshness

7.4

Popularity

9.3

Material

Learn the important features of the base
Platform: Udemy
Video: 8h 31m
Language: English
Next start: On Demand

Best R classes:

Classbaze Rating

Classbaze Grade®

8.4 / 10

CourseMarks Score® helps students to find the best classes. We aggregate 18 factors, including freshness, student feedback and content diversity.

Freshness

8.0 / 10
This course was last updated on 9/2020.

Course content can become outdated quite quickly. After analysing 71,530 courses, we found that the highest rated courses are updated every year. If a course has not been updated for more than 2 years, you should carefully evaluate the course before enrolling.

Popularity

7.4 / 10
We analyzed factors such as the rating (4.1/5) and the ratio between the number of reviews and the number of students, which is a great signal of student commitment.

New courses are hard to evaluate because there are no or just a few student ratings, but Student Feedback Score helps you find great courses even with fewer reviews.

Material

9.3 / 10
Video Score: 8.9 / 10
The course includes 8h 31m video content. Courses with more videos usually have a higher average rating. We have found that the sweet spot is 16 hours of video, which is long enough to teach a topic comprehensively, but not overwhelming. Courses over 16 hours of video gets the maximum score.
The average video length is 6 hours 00 minutes of 161 R courses on Udemy.
Detail Score: 9.5 / 10

The top online course contains a detailed description of the course, what you will learn and also a detailed description about the instructor.

Extra Content Score: 9.5 / 10

Tests, exercises, articles and other resources help students to better understand and deepen their understanding of the topic.

This course contains:

0 article.
10 resources.
0 exercise.
0 test.

In this page

About the course

Comprehensive Graphics with R is a thorough, comprehensive overview of each of three major graphics approaches in R: base, lattice, and ggplot. The course also demonstrates the use of the R Commander interface to create a variety of 2D and 3D graphics. Most of the course is engaged in live, “hands-on” demonstrations of creating a wide range of 2D and 3D plots and graphs using extensive scripts and data sets, all provided with the course materials. Adequate documentation including slides, exercises and exercise solutions are also provided. The course demonstrates (and uses) two of the most popular ‘front-ends’ to the R Console: R Commander and RStudio. We begin by exploring the range of graphics output available using both the R Commander and RStudio GUI interfaces to the R Console. The course then follows with a more in-depth examination of the graphics capabilities for each of the three main graphics systems, base, lattice, and ggplot.
This course is a ‘must see’ for anyone who will use R and wishes to get the most out of the stunning variety of graphical charts, plots, and even animations that are available. The R software was designed from the outset to be particularly strong in visualization and graphical capabilities. However, if you are unaware of the full range of these capabilities you are missing opportunities to apply this wide variety of rich, powerful graphics to your own work and research projects. Accordingly, this course is specifically designed to comprehensively demonstrate and explain the broad range of graphical outputs that are available with R.

What can you learn from this course?

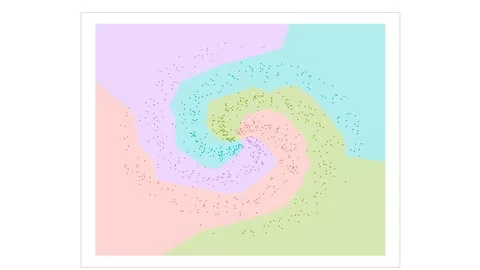
✓ Learn how to create a wide range of elegant and stunning graphical visualizations using the base, lattice and ggplot graphics systems in R.
✓ Learn to use the R Commander interface to create a variety of 2D and 3D graphics using different data sets.
✓ Learn to apply all of these graphical capabilities to your own data by practicing with all of the supplied course videos R scripts and by completiing each of the five sets of exercises – one for each section of the course.

What you need to start the course?

• Students will need to install the R console software, RStudio and the R Commander R packages. They are each free and instructions are provided with the course materials.

Who is this course is made for?

• Anyone who uses R software for any reason will benefit from this course, including beginning, intermediate and advanced R users.
• Anyone who wants to learn R will benefit from this course.
• The course is especially appropriate for graduate students and faculty who wish to learn a graphics software alternative to SPSS or SAS, as well as working data analytics professionals and other quantitative professionals.

Are there coupons or discounts for Comprehensive Graphics Visualizations with R ? What is the current price?

The course costs $14.99. And currently there is a 82% discount on the original price of the course, which was $84.99. So you save $70 if you enroll the course now.
The average price is $18.7 of 161 R courses. So this course is 20% cheaper than the average R course on Udemy.

Will I be refunded if I'm not satisfied with the Comprehensive Graphics Visualizations with R course?

YES, Comprehensive Graphics Visualizations with R has a 30-day money back guarantee. The 30-day refund policy is designed to allow students to study without risk.

Are there any financial aid for this course?

Currently we could not find a scholarship for the Comprehensive Graphics Visualizations with R course, but there is a $70 discount from the original price ($84.99). So the current price is just $14.99.

Who will teach this course? Can I trust Geoffrey Hubona, Ph.D.?

Geoffrey Hubona, Ph.D. has created 27 courses that got 4,030 reviews which are generally positive. Geoffrey Hubona, Ph.D. has taught 30,928 students and received a 4.0 average review out of 4,030 reviews. Depending on the information available, we think that Geoffrey Hubona, Ph.D. is an instructor that you can trust.
Associate Professor of Information Systems
Dr. Geoffrey Hubona has held full-time tenure-track, and tenured, assistant and associate professor faculty positions at 4 major state universities in the United States since 1993. Currently, he is an associate professor of MIS at Texas A&M International University where he teaches for-credit courses on Business Data Visualization (undergrad), Advanced Programming using R (graduate), and Data Mining and Business Analytics (graduate). In previous academic faculty positions, he taught dozens of various statistics, business information systems, and computer science courses to undergraduate, master’s and Ph.D. students. He earned a Ph.D. in Business Administration (Information Systems and Computer Science) from the University of South Florida (USF) in Tampa, FL; an MA in Economics, also from USF; an MBA in Finance from George Mason University in Fairfax, VA; and a BA in Psychology from the University of Virginia in Charlottesville, VA. He is the founder of the Georgia R School (2010-2014) and of R-Courseware (2014-Present), online educational organizations that teach research methods and quantitative analysis techniques. These research methods techniques include linear and non-linear modeling, multivariate methods, data mining, programming and simulation, and structural equation modeling and partial least squares (PLS) path modeling.
Browse all courses by on Classbaze.

8.4

Classbaze Grade®

8.0

Freshness

7.4

Popularity

9.3

Material

Platform: Udemy
Video: 8h 31m
Language: English
Next start: On Demand

Classbaze recommendations for you