Classbaze

Disclosure: when you buy through links on our site, we may earn an affiliate commission.

Data Visualization Using MatPlotLib & Seaborn

If you want to work in exciting analytics and data visualization project, then this is the starting point for you.
/5
(0 reviews)
0 students
Created by

8.5

Classbaze Grade®

9.2

Freshness

N/A

Popularity

7.3

Material

Platform: Simpliv Learning
Video: 4h13m
Language: English
Next start: On Demand

Best Data Science classes:

Classbaze Rating

Classbaze Grade®

8.5 / 10

CourseMarks Score® helps students to find the best classes. We aggregate 18 factors, including freshness, student feedback and content diversity.

Freshness

9.2 / 10
This course was last updated on 08/2020.

Course content can become outdated quite quickly. After analysing 71,530 courses, we found that the highest rated courses are updated every year. If a course has not been updated for more than 2 years, you should carefully evaluate the course before enrolling.

Popularity

We analyzed factors such as the rating and the ratio between the number of reviews and the number of students, which is a great signal of student commitment. If a course does not yet have a rating, we exclude Feedback Score from the overall CourseMarks Score.

New courses are hard to evaluate because there are no or just a few student ratings, but Student Feedback Score helps you find great courses even with fewer reviews.

Material

7.3 / 10
Video Score: 7.5 / 10
The course includes 4h13m video content. Courses with more videos usually have a higher average rating. We have found that the sweet spot is 16 hours of video, which is long enough to teach a topic comprehensively, but not overwhelming. Courses over 16 hours of video gets the maximum score.
The average video length is 5 hours 35 minutes of 540 Data Science courses on Simpliv Learning.
Detail Score: 8.9 / 10

The top online course contains a detailed description of the course, what you will learn and also a detailed description about the instructor.

Extra Content Score: 1.0 / 10

Tests, exercises, articles and other resources help students to better understand and deepen their understanding of the topic.

This course contains:

0 article.
0 resource.
0 exercise.
0 test.

In this page

About the course

If you want to work in exciting analytics and data visualization project, then this is the starting point for you.

Data is the currency of now and potential to use it the right way, at the right time for the right reason gives you possibility beyond imagination.

Data visualization is a vast topic and consist of many sub-parts which are a subject in itself, we in our course have tried to paint a clear picture of what you need to know and what people will be looking of you in a visualization project.

UX in Data visualization is key in modern times to meet the expectation of your user, this course will highlight what are the benefits of using a good UX and how to do it.

This course is structured to provide all the key aspect of Data visualization in most simple and clear fashion.So you can start the journey in Data visualization world.

What can you learn from this course?

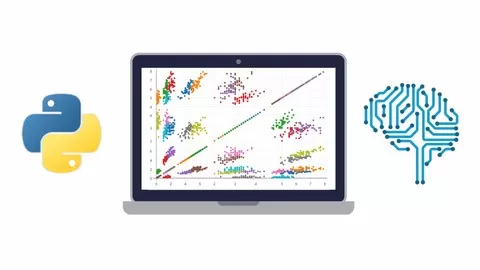
Matplotlib Introduction
✓ PyPlot, Bar, Pie, Histogram, Scatter & 3D Plot
✓ Multiple Plots in a Graph
✓ Seaborn Plotting Functions
✓ Plotting with Categorical Data
✓ Multi-Plot Grids
✓ Plot Aesthetics
✓ What is Data Science
✓ What is Machine Learning
✓ Data Visualization using Pandas

What you need to start the course?

• Just some high school mathematics level

Who is this course is made for?

• Beginner Python developers curious about Data Science

Are there coupons or discounts for Data Visualization Using MatPlotLib & Seaborn ? What is the current price?

The course costs $9.99. And currently there is a 80% discount on the original price of the course, which was $49.99. So you save $40 if you enroll the course now.
The average price is $11.5 of 540 Data Science courses. So this course is -13% more expensive than the average Data Science course on Simpliv Learning.

Will I be refunded if I'm not satisfied with the Data Visualization Using MatPlotLib & Seaborn course?

YES, Data Visualization Using MatPlotLib & Seaborn has a 20-day money back guarantee. The 20-day refund policy is designed to allow students to study without risk.

Are there any financial aid for this course?

Currently we could not find a scholarship for the Data Visualization Using MatPlotLib & Seaborn course, but there is a $40 discount from the original price ($49.99). So the current price is just $9.99.

Who will teach this course? Can I trust DATAhill Solutions Srinivas Reddy?

DATAhill Solutions Srinivas Reddy has created 25 courses that got 605 reviews which are generally positive. DATAhill Solutions Srinivas Reddy has taught 23,649 students and received a 4.1 average review out of 605 reviews. Depending on the information available, we think that DATAhill Solutions Srinivas Reddy is an instructor that you can trust.
Data Scientist
Mr. Srinivas Reddy is Founder & MD of DATAhill Solutions
He is Research Scholar (Ph.D) on Artificial Intelligence & Machine Learning
He Received Masters of Technology in Computer Science & Engineering from JNTU, MICROSOFT Certified Professional, IBM Certified Professional & Certified from IIT Kanpur & IIT Ropar.
Having 10+ Years of Experience in Software & Training.
His Experience includes Managing, Data Processing, Data Cleaning, Predicting and Analyzing of Large volume of Business Data.
Expertise in Data Science, Data Analytics, Machine Learning, Deep Learning, Artificial Intelligence, Python, R, Weka, Data Management & BI Technologies.
Having Patents and Publications in Various Fields such as Artificial Intelligence, Machine Learning and Data Science Technologies.
Professionally, He is Data Science Management Consultant with over 7+ years of Experience in Finance, Retail, Transport and other Industries.
Browse all courses by on Classbaze.

8.5

Classbaze Grade®

9.2

Freshness

N/A

Popularity

7.3

Material

Platform: Simpliv Learning
Video: 4h13m
Language: English
Next start: On Demand

Classbaze recommendations for you