Classbaze

Disclosure: when you buy through links on our site, we may earn an affiliate commission.

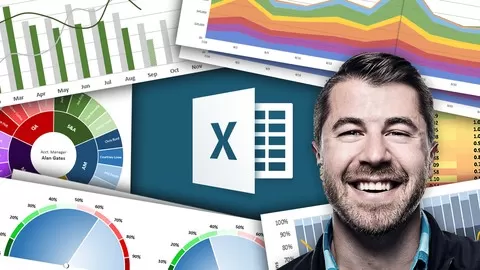
Excel Magic 7: Creating Excel Charts like a PRO

Learn how to build some of the most stunning charts in Excel!
0.0
0.0/5
(0 reviews)
2 students
Created by

8.4

Classbaze Grade®

9.0

Freshness

N/A

Popularity

7.4

Material

Learn how to build some of the most stunning charts in Excel!
Platform: Udemy
Video: 1h 16m
Language: English
Next start: On Demand

Best Excel classes:

Classbaze Rating

Classbaze Grade®

8.4 / 10

CourseMarks Score® helps students to find the best classes. We aggregate 18 factors, including freshness, student feedback and content diversity.

Freshness

9.0 / 10
This course was last updated on 6/2021.

Course content can become outdated quite quickly. After analysing 71,530 courses, we found that the highest rated courses are updated every year. If a course has not been updated for more than 2 years, you should carefully evaluate the course before enrolling.

Popularity

We analyzed factors such as the rating (0.0/5) and the ratio between the number of reviews and the number of students, which is a great signal of student commitment.

New courses are hard to evaluate because there are no or just a few student ratings, but Student Feedback Score helps you find great courses even with fewer reviews.

Material

7.4 / 10
Video Score: 7.7 / 10
The course includes 1h 16m video content. Courses with more videos usually have a higher average rating. We have found that the sweet spot is 16 hours of video, which is long enough to teach a topic comprehensively, but not overwhelming. Courses over 16 hours of video gets the maximum score.
The average video length is 4 hours 36 minutes of 923 Excel courses on Udemy.
Detail Score: 9.1 / 10

The top online course contains a detailed description of the course, what you will learn and also a detailed description about the instructor.

Extra Content Score: 5.5 / 10

Tests, exercises, articles and other resources help students to better understand and deepen their understanding of the topic.

This course contains:

0 article.
0 resource.
0 exercise.
0 test.

In this page

About the course

The course is presented in four parts.

First, the course reveals the 4 popular Excel Charts used by everyone. They are:
o Column chart
o Bar chart
o Line chart
o Pie chart

Next, the course presents 10 mostly used Excel Charting techniques, including:
o How to show a regression trendline?
o How to make charts dynamic for self-service reporting?
o How to make a Chart Title dynamic?
o How to highlight a column?

Third, the course demonstrates how to build 3 powerful Excel Charts that are rarely used. They are:
o Combo Chart
o Waterfall Chart
o Gauge Chart

Last, the course illustrates 4 best practices in Excel Charting. They are:
o Remove duplicate information from the Chart
o Avoid using 3-D Pie Chart
o Sort in Column/Bar charts
o Avoid distorted axis

Learning Objectives
● Master 4 basic but popular Excel charts
● Recognize 4 basic formatting techniques
● Discover 6 intermediate charting techniques
● Explore how to build 3 powerful but rarely used Excel Charts
● Understand 4 best practices in building Excel Charts
What can you learn from this course?

✓ – to build some of the most stunning charts in Excel
✓ – to make yourself the go-to-person in their office, or
✓ – to be well positioned for your next promotion!

What you need to start the course?

• Basic Excel
• Example: be able to open one Excel file, etc.

Who is this course is made for?

• Office workers, Professionals, and Managers

Are there coupons or discounts for Excel Magic 7: Creating Excel Charts like a PRO ? What is the current price?

The course costs $14.99. And currently there is a 82% discount on the original price of the course, which was $84.99. So you save $70 if you enroll the course now.
The average price is $17.3 of 923 Excel courses. So this course is 13% cheaper than the average Excel course on Udemy.

Will I be refunded if I'm not satisfied with the Excel Magic 7: Creating Excel Charts like a PRO course?

YES, Excel Magic 7: Creating Excel Charts like a PRO has a 30-day money back guarantee. The 30-day refund policy is designed to allow students to study without risk.

Are there any financial aid for this course?

Currently we could not find a scholarship for the Excel Magic 7: Creating Excel Charts like a PRO course, but there is a $70 discount from the original price ($84.99). So the current price is just $14.99.

Who will teach this course? Can I trust Lenny Wu, MBA, CPA, CGA?

Lenny Wu, MBA, CPA, CGA has created 22 courses that got 39 reviews which are generally positive. Lenny Wu, MBA, CPA, CGA has taught 203 students and received a 4.1 average review out of 39 reviews. Depending on the information available, we think that Lenny Wu, MBA, CPA, CGA is an instructor that you can trust.
Online Professional Development Instructor
Lenny Wu was a Lecturer at Tsinghua University in Beijing, China. He also sat as an Examiner for the International English Language Testing System (or IELTS) in the 1990s. On top of these, he is an exam trainer for various high profile exams, such as GRE (or Graduate Record Examination), GMAT (or Graduate Management Admission Test), TOEFL (or Test of English as a Foreign Language),  and math contests such as Euler, Gauss and Pascal. He has published books on test taking strategies.
Lenny received his MBA, Finance from The George Washington University in Washington, DC, USA, and currently is a Senior Financial Analyst with an international engineering company in Vancouver, BC, Canada.
Lenny’s motto at work is “Don’t work hard, work smart”. Lenny has passion in teaching how to build your own “robot” into everyday office work. He has over over 22 years working with Microsoft Excel, and he is a modeling expert in Power Query, Power Pivot, and Power BI.
Lenny is a big proponent of OCR (One-click Reporting), and SSR (Self-service Reporting).

8.4

Classbaze Grade®

9.0

Freshness

N/A

Popularity

7.4

Material

Platform: Udemy
Video: 1h 16m
Language: English
Next start: On Demand

Classbaze recommendations for you