Classbaze

Disclosure: when you buy through links on our site, we may earn an affiliate commission.

How To Read candles stock charts for intraday trading

How to Read Stock Charts & Stock Patterns
0.0
0.0/5
(0 reviews)
11 students
Created by

9.2

Classbaze Grade®

9.2

Freshness

N/A

Popularity

8.8

Material

How to Read Stock Charts & Stock Patterns
Platform: Udemy
Video: 1h 18m
Language: English
Next start: On Demand

Best Day Trading classes:

Classbaze Rating

Classbaze Grade®

9.2 / 10

CourseMarks Score® helps students to find the best classes. We aggregate 18 factors, including freshness, student feedback and content diversity.

Freshness

9.2 / 10
This course was last updated on 8/2021.

Course content can become outdated quite quickly. After analysing 71,530 courses, we found that the highest rated courses are updated every year. If a course has not been updated for more than 2 years, you should carefully evaluate the course before enrolling.

Popularity

We analyzed factors such as the rating (0.0/5) and the ratio between the number of reviews and the number of students, which is a great signal of student commitment.

New courses are hard to evaluate because there are no or just a few student ratings, but Student Feedback Score helps you find great courses even with fewer reviews.

Material

8.8 / 10
Video Score: 7.7 / 10
The course includes 1h 18m video content. Courses with more videos usually have a higher average rating. We have found that the sweet spot is 16 hours of video, which is long enough to teach a topic comprehensively, but not overwhelming. Courses over 16 hours of video gets the maximum score.
The average video length is 3 hours 39 minutes of 139 Day Trading courses on Udemy.
Detail Score: 9.1 / 10

The top online course contains a detailed description of the course, what you will learn and also a detailed description about the instructor.

Extra Content Score: 9.5 / 10

Tests, exercises, articles and other resources help students to better understand and deepen their understanding of the topic.

This course contains:

12 articles.
0 resource.
0 exercise.
0 tests or quizzes.

In this page

About the course

Intraday trading is a method of investing in stocks where the trader buys and sells stocks on the same day without any open positions left by the end of the day. Hence, intraday traders try to either purchase a share at a low price and sell it higher or short-sell a share at a high price and buy it lower within the same day. This requires a good understanding of the market and relevant information that can help them make the right decisions. In the stock market, the price of a share is determined by its demand and supply.
Also, the demand and supply of a particular stock rely heavily on the perception of a majority of investors. Further, this perception is influenced by various factors like economic conditions, political stability, social events, the performance of the company, etc. While it is impossible for traders to stay at the top of all factors that influence the share price, by carefully analyzing the market/stock’s performance, they can make efficient trading decisions. One such tool available to day traders is a Candlestick Chart. we will talk about these Candlestick Charts and offer steps to help you read them.

Reading a Candlestick Chart
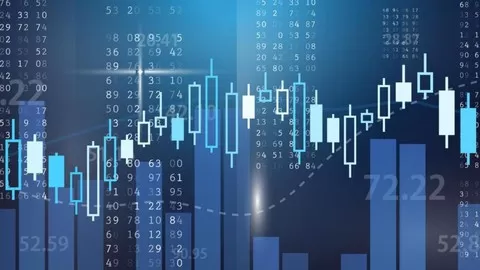
The body of the candle represents the opening and closing price of the trading done during the period. Hence, traders can see the price range of the said stock for the said period at a glance. Also, the color of the body can tell them if the stock price is rising or falling. So, if a candlestick chart for one month with each candle representing a day has more consecutive reds, then traders know that the price is falling.
Above and below the body are vertical lines called wicks or shadows that show the lows and highs of the traded price of the stock. Here is a scenario:
•If the upper wick on a red candle is short, then it indicates that the stock opened near the high of the day.
•On the other hand, if the upper wick on a green candle is short, then it indicates that the stock closed near the high of the day.
Hence, a candlestick chart displays the relationship between the high, low, opening, and closing price of a stock. The body can be long or short and red or green. Also, shadows can be long or short. A combination of these displays the sentiment of the market towards the said stock.

Patterns in Candlestick Charts
Candlestick charts are an excellent way of understanding the investor sentiment and the relationship between demand and supply, bears and bulls, greed and fear, etc. Traders must remember that while an individual candle provides sufficient information, patterns can be determined only by comparing one candle with its preceding and next candles. To benefit from them, it is important that traders understand patterns in candlestick charts. For better understanding let’s divide the patterns into two sections:
•Bullish patterns
•Bearish patterns
What can you learn from this course?

✓ daytrading
✓ stocks
✓ stock market
✓ finances
✓ investments
✓ swing trading

What you need to start the course?

• A computer and basic understanding of the stock market

Who is this course is made for?

• Anyone with interest in the stock market and financial sector

Are there coupons or discounts for How To Read candles stock charts for intraday trading ? What is the current price?

The course costs $14.99. And currently there is a 25% discount on the original price of the course, which was $19.99. So you save $5 if you enroll the course now.
The average price is $21.0 of 139 Day Trading courses. So this course is 29% cheaper than the average Day Trading course on Udemy.

Will I be refunded if I'm not satisfied with the How To Read candles stock charts for intraday trading course?

YES, How To Read candles stock charts for intraday trading has a 30-day money back guarantee. The 30-day refund policy is designed to allow students to study without risk.

Are there any financial aid for this course?

Currently we could not find a scholarship for the How To Read candles stock charts for intraday trading course, but there is a $5 discount from the original price ($19.99). So the current price is just $14.99.

Who will teach this course? Can I trust Tyler Aaron?

Tyler Aaron has created courses that got 0 reviews which are generally positive. Tyler Aaron has taught 0 students and received a average review out of 0 reviews. Depending on the information available, we think that Tyler Aaron is an instructor that you can trust.
Crypto and Trader Instructor
Socrates Trading is one of the largest communities of active day traders and investors. We provide educational content to over 5,000+ active followers and over 500+ premium members growing every single day. The global trading community has gathered around Socrates Trading because we create profitable traders with a lifestyle of freedom and independence. Regardless of where you are located or what your schedule is, you’ll find friends, community, and proven education at Socrates Trading.

9.2

Classbaze Grade®

9.2

Freshness

N/A

Popularity

8.8

Material

Platform: Udemy
Video: 1h 18m
Language: English
Next start: On Demand

Classbaze recommendations for you