This course was last updated on 6/2022.
We analyzed factors such as the rating (4.6/5) and the ratio between the number of reviews and the number of students, which is a great signal of student commitment.
The Finance and Investment Industry is experiencing a dramatic change driven by ever-increasing processing power & connectivity and the introduction of powerful Machine Learning tools. The Finance and Investment Industry is more and more shifting from a math/formula-based business to a data-driven business.
What can you do to keep pace?
No matter if you want to dive deep into Machine Learning, or if you simply want to increase productivity at work when handling Financial Data, there is the very first and most important step: Leave Excel behind and manage your Financial Data with Python and Pandas!
Pandas is the Excel for Python and learning Pandas from scratch is almost as easy as learning Excel. Pandas seems to be more complex at a first glance, as it simply offers so much more functionalities. The workflows you are used to do with Excel can be done with Pandas more efficiently. Pandas is a high-level coding library where all the hardcore coding stuff with dozens of coding lines are running automatically in the background. Pandas operations are typically done in one line of code! However, it is important to learn and master Pandas in a way that
•you understand what is going on
•you are aware of the pitfalls (Don´ts)
•you know best practices (Dos)
MANAGE FINANCE DATA WITH PYTHON & PANDAS best prepares you to master the new challenges and to stay ahead of your peers, fellows and competitors! Coding with Python/Pandas is one of the most in-Demand skills in Finance.
This course is one of the most practical courses on Udemy with 200 Coding Exercises and a Final Project. You are free to select your individual level of difficulty. If you have no experience with Pandas at all, Part 1 will teach you all essentials (From Zero to Hero).
Part 2 – The Core of this Course
•Import Financial Data from Free Web Sources, Excel- and CSV-Files
•Calculate Risk, Return, and Correlation of Stocks, Indexes and Portfolios
•Calculate simple Returns, log Returns, and annualized Returns & Risk
•Create your own customized Financial Index (price-weighted vs. equal-weighted vs. value-weighted)
•Understand the difference between Price Return and Total Return
•Create, analyze and optimize Stock Portfolios
•Calculate Sharpe Ratio, Systematic Risk, Unsystematic Risk, Beta and Alpha for Stocks, Indexes and Portfolios
•Understand Modern Portfolio Theory, Risk Diversification and the Capital Asset Pricing Model (CAPM)
•Forward-looking Mean-Variance Optimization (MVO) and its pitfalls
•Get an exclusive insight into how MVO is used in Real World (and why it is NOT used in many cases) -> get beyond Investments 101 level!
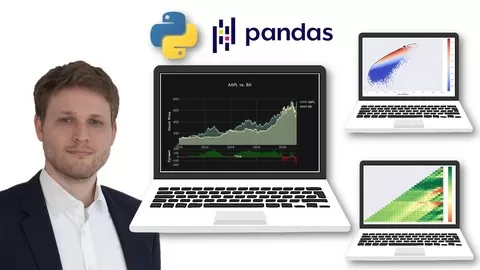
•Calculate Rolling Statistics (e.g. Simple Moving Averages) and aggregate, visualize and report Financial Performance
•Create Interactive Charts with Technical Indicators (SMA, Candle Stick, Bollinger Bands etc.)
Part 3 – Capstone Project
Step into the Financial Analyst / Advisor Role and give advice on a Client´s Portfolio (Final Project Challenge).
Apply and master what you have learned before!
Part 4
Some advanced topics on handling Time Series Data with Pandas.
Appendix
Do you struggle with some basic Python / Numpy concepts? Here is all you need to know if you are completely new to Python!
Why you should listen to me…
In my career, I have built an extensive level of expertise and experience in both areas: Finance and Coding
Finance:
•10 years experience in the Finance and Investment Industry…
•…where I held various quantitative & strategic positions.
•MSc in Finance
•Passed all three CFA Exams (currently no active member of the CFA Institute)
Python & Pandas:
•I led a company-wide transformation from Excel to Python/Pandas
•Code, models, and workflows are Real World Project-proven
•Instructor of the highest-rated and most trending general Course on Pandas
What are you waiting for? Guaranteed Satisfaction: Otherwise, get your money back with 30-Days-Money-Back-Guarantee.
Looking Forward to seeing you in the Course!
✓ Step into the Financial Analyst role and give advice on a client´s financial Portfolio (Final Project)
✓ Import large Financial Datasets / historical Prices from Web Sources and analyze, aggregate and visualize them
✓ Calculate Return, Risk, Correlation and Rolling Statistics for Stocks, Indexes and Portfolios
✓ Create, analyze and optimize financial Portfolios and understand the use of the Sharpe Ratio
✓ Intuitively understand Modern Portfolio Theory (CAPM, Beta, Alpha, CML, SML, Risk Diversification) with Real Data examples
✓ Create Interactive Price Charts with Technical Indicators (Volume, OHLC, Candlestick, SMA etc.)
✓ Create Financial Indexes (price-, equal- and value- weighted) and understand the difference between Price Return and Total Return
✓ Easily switch between daily, weekly, monthly and annual returns and understand the benefits of log returns
✓ Start from Zero and learn all the Basics of the powerful Pandas Library
• No specific Finance knowledge needed! The course intuitively explains the major fundamentals of Finance and Portfolio Theorie based on data examples.
• Ideally some Spreadsheet Basics/Programming Basics (not mandatory, the course guides you through the basics)
• A desktop computer (Windows, Mac, or Linux) capable of storing and running Anaconda. The course will walk you through installing the necessary free software.
• An internet connection capable of streaming videos
• Some high school level math skills would be great (not mandatory, but it helps)
• Investment & Finance Professionals who want to transition from Excel into Python to boost their careers and working efficiency.
• (Finance) Students and Researchers who need to handle large datasets and reached the limits of Excel.
• Data Scientists who want to improve their Data Handling/Manipulation skills (in particular for Time Series Data)
• Everyone who want to step into (Financial) Data Science. Pandas is Key to everything.
• Everyone curious about how Financial Performance is measured and how (Stock) Indexes and Portfolios are created, analyzed, visualized and optimized. It´s the easiest way to understand the concepts with data examples rather than theories and formulas.
The course costs $19.99. And currently there is a 83% discount on the original price of the course, which was $119.99. So you save $100 if you enroll the course now.
YES, Manage Finance Data with Python & Pandas: Unique Masterclass has a 30-day money back guarantee. The 30-day refund policy is designed to allow students to study without risk.
Alexander Hagmann has created 14 courses that got 8,214 reviews which are generally positive. Alexander Hagmann has taught 71,877 students and received a 4.6 average review out of 8,214 reviews. Depending on the information available, we think that Alexander Hagmann is an instructor that you can trust.
Data Scientist | Finance Professional | Entrepreneur
Alexander is a Data Scientist and Finance Professional with more than 10 years of experience in the Finance and Investment Industry.
He is also a Bestselling Udemy Instructor for
– Data Analysis/Manipulation with Pandas
– (Financial) Data Science
– Python for Business and Finance
– Algorithmic Trading
Alexander started his career in the traditional Finance sector and moved step-by-step into Data-driven and Artificial Intelligence-driven Finance roles. He is currently working on cutting-edge Fintech projects and creates solutions for Algorithmic Trading and Robo Investing. And Alexander is excited to share his knowledge with others here on Udemy. Students who completed his courses work in the largest and most popular tech and finance companies all over the world.
Alexander´s courses have one thing in common: Content and concepts are practical and real-world proven. The clear focus is on acquiring skills and understanding concepts rather than memorizing things.
Alexander holds a Master´s degree in Finance and passed all three CFA Exams (he is currently no active member of the CFA Institute).