Classbaze

Disclosure: when you buy through links on our site, we may earn an affiliate commission.

Statistics & Probability for Data Science

Building on the Foundation: Probability, Descriptive Statistics- Part2, Data Visualization, Covariance and Correlation
3.7
3.7/5
(106 reviews)
34,698 students
Created by

7.6

Classbaze Grade®

7.6

Freshness

6.4

Popularity

8.2

Material

Building on the Foundation: Probability
Platform: Udemy
Video: 11h 55m
Language: English
Next start: On Demand

Best Data Science classes:

Classbaze Rating

Classbaze Grade®

7.6 / 10

CourseMarks Score® helps students to find the best classes. We aggregate 18 factors, including freshness, student feedback and content diversity.

Freshness

7.6 / 10
This course was last updated on 5/2020.

Course content can become outdated quite quickly. After analysing 71,530 courses, we found that the highest rated courses are updated every year. If a course has not been updated for more than 2 years, you should carefully evaluate the course before enrolling.

Popularity

6.4 / 10
We analyzed factors such as the rating (3.7/5) and the ratio between the number of reviews and the number of students, which is a great signal of student commitment.

New courses are hard to evaluate because there are no or just a few student ratings, but Student Feedback Score helps you find great courses even with fewer reviews.

Material

8.2 / 10
Video Score: 9.4 / 10
The course includes 11h 55m video content. Courses with more videos usually have a higher average rating. We have found that the sweet spot is 16 hours of video, which is long enough to teach a topic comprehensively, but not overwhelming. Courses over 16 hours of video gets the maximum score.
The average video length is 5 hours 35 minutes of 540 Data Science courses on Udemy.
Detail Score: 9.7 / 10

The top online course contains a detailed description of the course, what you will learn and also a detailed description about the instructor.

Extra Content Score: 5.5 / 10

Tests, exercises, articles and other resources help students to better understand and deepen their understanding of the topic.

This course contains:

0 article.
0 resource.
0 exercise.
0 test.

In this page

About the course

Building on the Foundation: Probability, Descriptive Statistics- Part2, Data Visualization, Covariance and Correlation
In this course we build your foundation on Data Science. Now that you have the insights and clarity on what data science is about after going through our Part 1 Course, we will take you through sessions on Probability, Descriptive Statistics, Data Visualization, Histogram, Boxplot & Scatter plot, You will learn that Covariance gives an idea about the direction of the data with examples, you will also learn Correlation with examples.

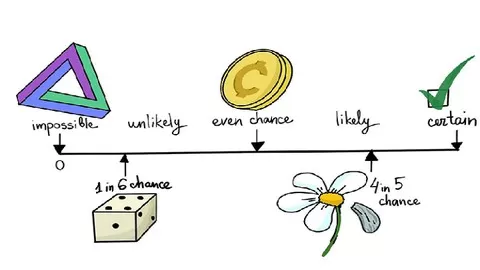
Probability is the mathematical term for the likelihood that something will occur, such as drawing an ace from a deck of cards or picking a green piece of candy from a bag of assorted colors. You use probability in daily life to make decisions when you don’t know for sure what the outcome will be. Most of the time, you won’t perform actual probability problems, but you’ll use subjective probability to make judgment calls and determine the best course of action.
Descriptive statistics consist of methods for organizing and summarizing information (Weiss, 1999). Descriptive statistics include the construction of graphs, charts, and tables, and the calculation of various descriptive measures such as averages, measures of variation, and percentiles.
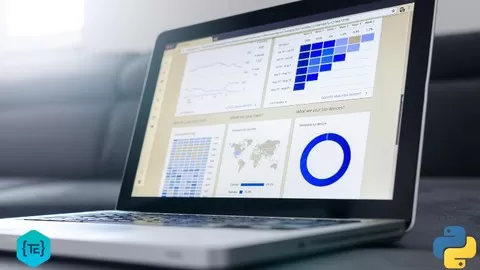
Data visualization is a graphical representation of information and data. By using visual elements like charts, graphs, and maps, data visualization tools provide an accessible way to see and understand trends, outliers, and patterns in data. In the world of Big Data, data visualization tools and technologies are essential to analyze massive amounts of information and make data-driven decisions.
Covariance and Correlation are two concepts in the field of probability and statistics. Both are concepts that describe the relationship between two variables to each other. Also, both are tools of measurement of a certain kind of dependence between variables.

Through our Four-part series we will take you step by step, this is our second part which will build your foundation.

What can you learn from this course?

✓ Probability tells us how often some event will happen after many repeated trials, we start off with an introduction to this interesting topic.
✓ You will get more clarity and will learn hands-on by solving several examples on Probability
✓ You will learn more about variables,mean,median and mode etc
✓ You will learn insights on descriptive statistics
✓ You will learn the degrees of freedom, mathematical operations
✓ You will learn more about discrete and continuous random variables
✓ You will learn through hands-on examples on Properties of E(x)
✓ You will learn the Art of Data Visualization
✓ You will learn how to compile Histogram and Boxplot with examples
✓ You will learn through examples on how to create Boxplot and Scatter plot
✓ You will learn that Covariance gives idea about direction of the data with examples, you will also learn Correlation with examples

What you need to start the course?

• No prior experience is required. We will start from the very basics. You will benefit by going through our part 1 course which lays the foundation

Who is this course is made for?

• The course is also ideal for beginners, as it starts from the fundamentals and gradually builds up your skills
• You should take this course if you want to become a Data Scientist or if you want to learn about the field

Are there coupons or discounts for Statistics & Probability for Data Science ? What is the current price?

The course costs $14.99. And currently there is a 70% discount on the original price of the course, which was $49.99. So you save $35 if you enroll the course now.
The average price is $11.5 of 540 Data Science courses. So this course is 30% more expensive than the average Data Science course on Udemy.

Will I be refunded if I'm not satisfied with the Statistics & Probability for Data Science course?

YES, Statistics & Probability for Data Science has a 30-day money back guarantee. The 30-day refund policy is designed to allow students to study without risk.

Are there any financial aid for this course?

Currently we could not find a scholarship for the Statistics & Probability for Data Science course, but there is a $35 discount from the original price ($49.99). So the current price is just $14.99.

Who will teach this course? Can I trust Sai Acuity Institute of Learning Pvt Ltd Enabling Learning Through Insight!?

Sai Acuity Institute of Learning Pvt Ltd Enabling Learning Through Insight! has created 45 courses that got 6,261 reviews which are generally positive. Sai Acuity Institute of Learning Pvt Ltd Enabling Learning Through Insight! has taught 313,315 students and received a 4.0 average review out of 6,261 reviews. Depending on the information available, we think that Sai Acuity Institute of Learning Pvt Ltd Enabling Learning Through Insight! is an instructor that you can trust.
Cybersecurity, Data Science & Human Capital Practitioners!
We specialize in Cybersecurity, Data Science and Talent Management/Human capital management training. The USP of all our training’s is the hands-on that we provide, our focus is on real-life practical knowledge sharing, and not tool-based PPT slides. All our training’s are conducted by highly experienced practitioners who are dyed-in-the-wool penetration testers. The material is cutting edge and updated with even the most recent developments. We have a standard set of courses outlined in different information security domains, data analytics domains and Talent management domain. However, we also customize the training according to the clients’ requirements.

7.6

Classbaze Grade®

7.6

Freshness

6.4

Popularity

8.2

Material

Platform: Udemy
Video: 11h 55m
Language: English
Next start: On Demand

Classbaze recommendations for you