Classbaze

Disclosure: when you buy through links on our site, we may earn an affiliate commission.

Python Data Analysis & Visualization Bootcamp

Financial Data Analysis and Visualization with Python: The HighQuality Study kit
4.5
4.5/5
(3,486 reviews)
7,617 students
Created by

9.3

Classbaze Grade®

9.6

Freshness

10.0

Popularity

7.6

Material

Financial Data Analysis and Visualization with Python: The HighQuality Study kit ranked as bestseller
Platform: Udemy
Video: 8h 6m
Language: English
Next start: On Demand

Best Data Analysis classes:

Classbaze Rating

Classbaze Grade®

9.3 / 10

CourseMarks Score® helps students to find the best classes. We aggregate 18 factors, including freshness, student feedback and content diversity.

Freshness

9.6 / 10
This course was last updated on 12/2021.

Course content can become outdated quite quickly. After analysing 71,530 courses, we found that the highest rated courses are updated every year. If a course has not been updated for more than 2 years, you should carefully evaluate the course before enrolling.

Popularity

10.0 / 10
We analyzed factors such as the rating (4.5/5) and the ratio between the number of reviews and the number of students, which is a great signal of student commitment.

New courses are hard to evaluate because there are no or just a few student ratings, but Student Feedback Score helps you find great courses even with fewer reviews.

Material

7.6 / 10
Video Score: 8.8 / 10
The course includes 8h 6m video content. Courses with more videos usually have a higher average rating. We have found that the sweet spot is 16 hours of video, which is long enough to teach a topic comprehensively, but not overwhelming. Courses over 16 hours of video gets the maximum score.
The average video length is 4 hours 49 minutes of 559 Data Analysis courses on Udemy.
Detail Score: 8.6 / 10

The top online course contains a detailed description of the course, what you will learn and also a detailed description about the instructor.

Extra Content Score: 5.5 / 10

Tests, exercises, articles and other resources help students to better understand and deepen their understanding of the topic.

This course contains:

0 article.
0 resource.
0 exercise.
0 test.

In this page

About the course

Welcome to Data Analysis Analytics Bootcamp content powered by TakenMind.

Are you interested to learn how zetabytes of data are processed by top tech companies to analyse data inorder to boost their business growth? Well, for a beginner you are at the right place and this is the most probably the right time for you to learn this. 
The average data scientist today earns $123,000 a year, according to Indeed research. But the operating term here is “today,” since data science has paid increasing dividends since it really burst into business consciousness in recent years.

This course has its base on financial Analysis and the following concepts are covered:
•Python Fundamentals
•Pandas for Efficient Data Analysis
•NumPy for High Speed Numerical Processing
•Matplotlib for Data Visualization
•Pandas for Data Manipulation and Analysis
•Seaborn Data Visualization
•Worked-up examples.

Learn how to analyze data using Python. This course will take you from the basics of Python to exploring many different types of data. You will learn how to prepare data for analysis, perform simple statistical analyses, create meaningful data visualizations, predict future trends from data, and more!
You will learn how to:
•Import data sets
•Clean and prepare data for analysis
•Manipulate pandas DataFrame
•Summarize data
•Build machine learning models using scikit-learn
•Build data pipelines
Data Analysis with Python is delivered through lecture, hands-on labs, and assignments. It includes following parts:
•Data Analysis libraries: will learn to use Pandas DataFrames, Numpy multi-dimentional arrays, and SciPy libraries to work with a various datasets. We will introduce you to pandas, an open-source library, and we will use it to load, manipulate, analyze, and visualize cool datasets. Then we will introduce you to another open-source library, scikit-learn, and we will use some of its machine learning algorithms to build smart models and make cool predictions.
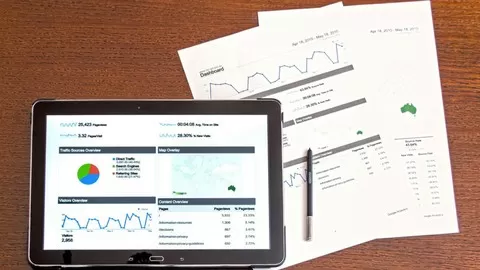

What can you learn from this course?

✓ Perform Data Analytics seamlessly and smartly

What you need to start the course?

• Experience in using a Computer – Windows/Linux/Mac
• Basic Mathematical Knowledge

Who is this course is made for?

• Beginner Python Data Analyst should take up this course.
• Intermediate Python Data Analyst should take up this course.

Are there coupons or discounts for Python Data Analysis & Visualization Bootcamp ? What is the current price?

The course costs $24.99. And currently there is a -250 discount on the original price of the course, which was $19.99. So you save $-5 if you enroll the course now.
The average price is $8.1 of 559 Data Analysis courses. So this course is -209% cheaper than the average Data Analysis course on Udemy.

Will I be refunded if I'm not satisfied with the Python Data Analysis & Visualization Bootcamp course?

YES, Python Data Analysis & Visualization Bootcamp has a 30-day money back guarantee. The 30-day refund policy is designed to allow students to study without risk.

Are there any financial aid for this course?

Currently we could not find a scholarship for the Python Data Analysis & Visualization Bootcamp course, but there is a $-5 discount from the original price ($19.99). So the current price is just $24.99.

Who will teach this course? Can I trust Python Data Analytics Data Science?

Python Data Analytics Data Science has created 1 courses that got 3,486 reviews which are generally positive. Python Data Analytics Data Science has taught 7,617 students and received a 4.5 average review out of 3,486 reviews. Depending on the information available, we think that Python Data Analytics Data Science is an instructor that you can trust.
Data Scientist Group
The author has worked as a product manager for the past few years and has shared his knowledge on effectively analyzing data points. He has a background in data analysis, visualization and managing technological products.
Browse all courses by on Classbaze.

9.3

Classbaze Grade®

9.6

Freshness

10.0

Popularity

7.6

Material

Platform: Udemy
Video: 8h 6m
Language: English
Next start: On Demand

Classbaze recommendations for you