Classbaze

Disclosure: when you buy through links on our site, we may earn an affiliate commission.

Create Interactive Dashboard using MS Excel

Truly practical course to convert your raw data in to meaningful dashboard (Template and Data included)
0.0
0.0/5
(0 reviews)
1 students
Created by

9.6

Classbaze Grade®

10.0

Freshness

N/A

Popularity

8.8

Material

Truly practical course to convert your raw data in to meaningful dashboard (Template and Data included)
Platform: Udemy
Video: 1h 59m
Language: English
Next start: On Demand

Best Excel Dashboard classes:

Classbaze Rating

Classbaze Grade®

9.6 / 10

CourseMarks Score® helps students to find the best classes. We aggregate 18 factors, including freshness, student feedback and content diversity.

Freshness

10.0 / 10
This course was last updated on 5/2022.

Course content can become outdated quite quickly. After analysing 71,530 courses, we found that the highest rated courses are updated every year. If a course has not been updated for more than 2 years, you should carefully evaluate the course before enrolling.

Popularity

We analyzed factors such as the rating (0.0/5) and the ratio between the number of reviews and the number of students, which is a great signal of student commitment.

New courses are hard to evaluate because there are no or just a few student ratings, but Student Feedback Score helps you find great courses even with fewer reviews.

Material

8.8 / 10
Video Score: 7.8 / 10
The course includes 1h 59m video content. Courses with more videos usually have a higher average rating. We have found that the sweet spot is 16 hours of video, which is long enough to teach a topic comprehensively, but not overwhelming. Courses over 16 hours of video gets the maximum score.
Detail Score: 9.0 / 10

The top online course contains a detailed description of the course, what you will learn and also a detailed description about the instructor.

Extra Content Score: 9.5 / 10

Tests, exercises, articles and other resources help students to better understand and deepen their understanding of the topic.

This course contains:

0 article.
1 resources.
0 exercise.
0 test.

In this page

About the course

About this Course
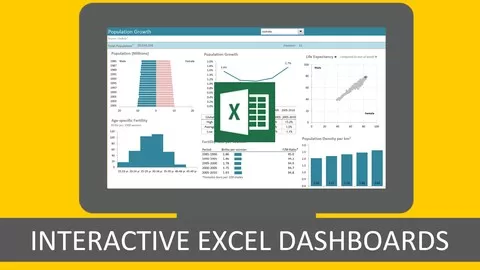
Data visualization is one of the key elements of report/MIS presentation nowadays, which can be done through a modern tool like interactive dynamic dashboards.
The easiest way to build your interactive dynamic dashboard is to use MS Excel software which is widely used worldwide to keep day-to-day data on marks.
Majority of the people find difficulty in getting the blueprint of the dashboard ready which ultimately leads to the poor quality of the Dashboard. Those dashboards are not insightful and do not help in taking decisions.

In this course, we have focused on creating a dashboard from scratch that is to create a dashboard blueprint based on your data. This will cater as a base to create a dashboard which has practical usefulness.

Here we have come up with a newly crafted workshop on “Learn Interactive Dashboard using MS Excel”. It will be helpful to the person who wants to enhance their skills and how to create a dashboard in excel. To make a dashboard, features like Pivot Table, Pivot charts, etc. are used.

Benefits
•Practical Dashboard from Scratch
•No prior expertise required
•Convert data into decision making
•Create interactive dashboard
•Experienced faculty
•Soft-copy of Material
•E-Certificate
Content
•What is Dashboard?
•Overview of types of Dashboard
•Benefits of using Dashboard
•Things to Do
•How to create a Dashboard in Excel
•Other BI Tools

What can you learn from this course?

✓ Understand the dashboard and its importance
✓ Converting a normal table to an excel table
✓ Use of pivot table to summarize the data
✓ Create a pivot chart for your data
✓ Create DASHBOARD of your Data
✓ Add interactivity to your dashboard using slicers

What you need to start the course?

• Basic knowledge of Excel is preferred
• Passion to learn dashboard

Who is this course is made for?

• MIS Executives
• Data Analyst Aspirants
• Business Professionals who use Excel to create dashboards and reports
• Those who currently use Excel and want to improve your skills
• Those who would like to learn how to create interactive reports

Are there coupons or discounts for Create Interactive Dashboard using MS Excel ? What is the current price?

The course costs $14.99. And currently there is a 25% discount on the original price of the course, which was $59. So you save $44 if you enroll the course now.

Will I be refunded if I'm not satisfied with the Create Interactive Dashboard using MS Excel course?

YES, Create Interactive Dashboard using MS Excel has a 30-day money back guarantee. The 30-day refund policy is designed to allow students to study without risk.

Are there any financial aid for this course?

Currently we could not find a scholarship for the Create Interactive Dashboard using MS Excel course, but there is a $44 discount from the original price ($59). So the current price is just $14.99.

Who will teach this course? Can I trust Hiren Kakkad?

Hiren Kakkad has created 1 courses that got — reviews which are generally positive. Hiren Kakkad has taught 1 students and received a — average review out of — reviews. Depending on the information available, we think that Hiren Kakkad is an instructor that you can trust.
Robust Kit of Solutions
Stat Modeller provides the solutions to the people who are looking for their data to analyze. We have a team of statistical experts who are having vast experience in academic, industries, research, consulting etc.
We have a team of statistical experts who are having vast experience in academic, industries, research, consulting etc.We provide reliable and quick service to our valuable clients.
Client satisfaction is our ultimate objective. We use latest software to analyze data like SPSS (Statistical Package for Social Science), R, Python, SAS, Minitab, Power BI, Tableau, MS Excel 2016 etc.
We at Stat Modeller provides various solutions to the researchers and the industries who are looking to get their problems solved through statistical analysis and data analysis.

9.6

Classbaze Grade®

10.0

Freshness

N/A

Popularity

8.8

Material

Platform: Udemy
Video: 1h 59m
Language: English
Next start: On Demand

Classbaze recommendations for you