
The course is presented in three parts.
First, the course reveals the 3 environments forecasts and budgets are made and compare each one of them.
Next, the course presents 6 challenges in budget modeling and reporting. They include:
o How to accommodate Operation Team’s need to work from Excel while all budgets are in the Planning system?
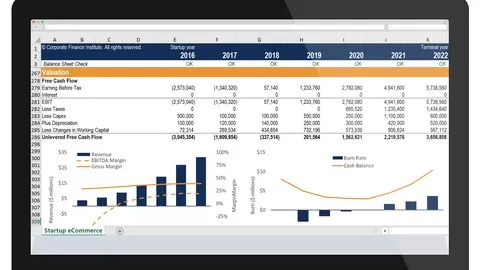
o How to build an interactive budgeting model in Excel?
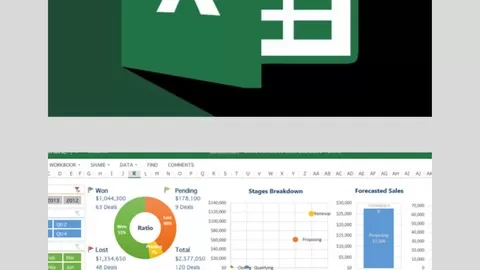
o How to write into a PivotTable?
Last, we provide 6 solutions to the above 6 challenges in budget modeling and reporting. They include:
o Building an interactive budgeting model that allows the Operation Team to make changes to forecasts and budgets and see the results instantaneously
o Building an “editable” PivotTable that allows Operation Team to put forecasts and budgets directly in the PivotTable report.
o Consolidating Actuals, Forecasts and Budgets from different data sources by using Power Query
o Building integrated Slides from Excel Reports:
Course Search Keywords
– Flat table
– Cross table
– Calculated field
– Calculated item
Learning Objectives
● Understand when and how to build an interactive budgeting model in Excel
● Identify reasons in building a PivotTable report vs a regular report with formulas
● Discover techniques on building an “editable” PivotTable
● Understand ways to report budgets from the System using a PivotTable
● Explore methods of consolidating Actuals and Budgets from multiple data sources