
The course is presented in three parts.
First, the course reveals the 3 shortcomings of presenting a pro-forma report. They are:
o Hard to slice and dice
o Hard to build a collapsible table on timeline
o Not for self-service
Next, the course presents 3 challenges in building a Pro-Forma report and provide solutions for the challenges. They include:
o How to Track On-hire Days for Each Vessel?
o How to Track Daily Hire Rates for Each Vessel?
o How to Calculate Net Hire Revenues?
Last, the course presents another 3 challenges in building a Dashboard report and provide solutions for the challenges. They include:
o How to convert Pro-forma report to a Dashboard report?
o How to build the Slice-and-dice function of a dashboard?
o How to display budgets, actuals and off-hires all in one chart?
Course Search Keywords:
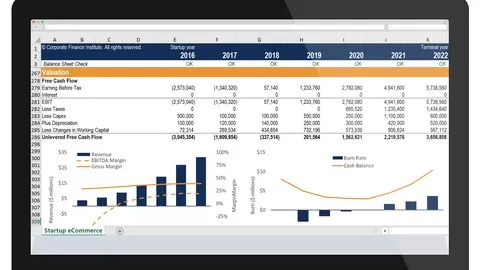
– Pro-Forma report
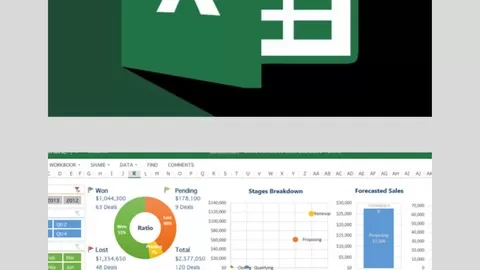
– Dashboard report
– Power Query
– Unpivot
– Reference
– Merge queries
– Slicer
– Timeline
– PivotChart
– Combo Chart
– Secondary Axis
Learning Objectives:
● Understand when and how to build a pro-forma report or a dashboard report
● Master the “golden” formulas to track days based on start/end dates and this/next periods
● Discover the way to model “staggered” daily rates and summarize into one table
● Recognize how to convert a cross-table to a flat-table
● Understand how to build a self-service dashboard that enables slice-and-dice