Classbaze

Disclosure: when you buy through links on our site, we may earn an affiliate commission.

Interactive Data Analysis Report Using Microsoft Excel

Interactive Data Analysis Report Using Microsoft Excel
0.0
0.0/5
(0 reviews)
2 students
Created by

9.6

Classbaze Grade®

9.8

Freshness

N/A

Popularity

8.9

Material

Interactive Data Analysis Report Using Microsoft Excel
Platform: Udemy
Video: 1h 58m
Language: English
Next start: On Demand

Best Data Analysis classes:

Classbaze Rating

Classbaze Grade®

9.6 / 10

CourseMarks Score® helps students to find the best classes. We aggregate 18 factors, including freshness, student feedback and content diversity.

Freshness

9.8 / 10
This course was last updated on 2/2022.

Course content can become outdated quite quickly. After analysing 71,530 courses, we found that the highest rated courses are updated every year. If a course has not been updated for more than 2 years, you should carefully evaluate the course before enrolling.

Popularity

We analyzed factors such as the rating (0.0/5) and the ratio between the number of reviews and the number of students, which is a great signal of student commitment.

New courses are hard to evaluate because there are no or just a few student ratings, but Student Feedback Score helps you find great courses even with fewer reviews.

Material

8.9 / 10
Video Score: 7.8 / 10
The course includes 1h 58m video content. Courses with more videos usually have a higher average rating. We have found that the sweet spot is 16 hours of video, which is long enough to teach a topic comprehensively, but not overwhelming. Courses over 16 hours of video gets the maximum score.
Detail Score: 9.4 / 10

The top online course contains a detailed description of the course, what you will learn and also a detailed description about the instructor.

Extra Content Score: 9.5 / 10

Tests, exercises, articles and other resources help students to better understand and deepen their understanding of the topic.

This course contains:

0 article.
5 resources.
0 exercise.
0 test.

In this page

About the course

Interactive Data Analysis Report Using Microsoft Excel

Basic Computer Requirements:
1. Microsoft Excel 2010-2019 or Office 365 (ideally for PC/Windows).
2. Basic experience with Excel functionality (formulas, pivot table, pivot chart, power point and outlook will be a plus point).

We’ll explore and analysis text and PDF datasets from a number of real-world case studies as follow:
1. Data Analysis Tools Database Analysis (Beginner)
2. Financial Database text Analysis (Intermediate)
3. Construction Database Analysis (Intermediate)
4. Financial Database PDF Analysis (Advanced)
5. Recall Fund Database Analysis (Advanced)

We’ll prepare you in 2 VBA Macro training as follow:
1. RPA VBA Macro Auto Task Schedule (Intermediate)
2. Prevent Screen Lock (Intermediate)

We’ll share will the future direction upon course completed as follow:
1. Next Step Direction

Who this course is for:
1. ANYONE who works with Microsoft Excel on a regular basis in the work place.
2. Microsoft Excel users who have basic data analysis skills but would like to become more proficient in data exploration and analysis.
3. Students looking for a step by step demonstration for data analysis training approach.
4. Anyone looking to pursue a career in data analysis or business intelligence.

This course compatible with Microsoft Excel 2007, Microsoft Excel 2010, Microsoft Excel 2013, Microsoft Excel 2016, Microsoft Excel 2019 or Microsoft Office 365.

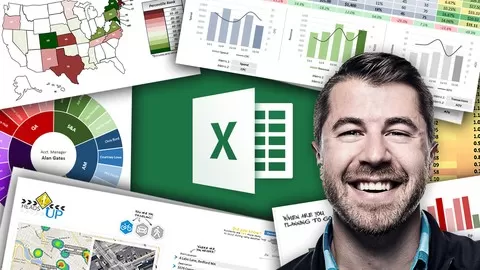
What can you learn from this course?

✓ Apply data analysis TECHNIQUES to database in Microsoft Excel Base on BUSINESS STATEMENT.
✓ Insert formulas to find out the HIDDEN data from the raw database in Microsoft Excel.
✓ Turn real world database into BUSINESS INSIGHTS in Microsoft Excel.
✓ Build INTERACTIVE report presentation in Microsoft Excel.
✓ VBA macro as to prepare you to AUTOMATE the entire Data Analysis process.

What you need to start the course?

• There is no requirement necessary to enrol the course.
• I will walk thru with you the entire process step by step.

Who is this course is made for?

• Beginner or existing data analyst that wants to expand their current skills.
• Anyone who wish to learn with open mind and ready top learn.

Are there coupons or discounts for Interactive Data Analysis Report Using Microsoft Excel ? What is the current price?

The course costs $14.99. And currently there is a 25% discount on the original price of the course, which was $59. So you save $44 if you enroll the course now.

Will I be refunded if I'm not satisfied with the Interactive Data Analysis Report Using Microsoft Excel course?

YES, Interactive Data Analysis Report Using Microsoft Excel has a 30-day money back guarantee. The 30-day refund policy is designed to allow students to study without risk.

Are there any financial aid for this course?

Currently we could not find a scholarship for the Interactive Data Analysis Report Using Microsoft Excel course, but there is a $44 discount from the original price ($59). So the current price is just $14.99.

Who will teach this course? Can I trust Poon Huangkai Levin?

Poon Huangkai Levin has created 1 courses that got — reviews which are generally positive. Poon Huangkai Levin has taught 2 students and received a — average review out of — reviews. Depending on the information available, we think that Poon Huangkai Levin is an instructor that you can trust.
Management Information Services & Robotic Process Automation
Hi everyone, my name is Levin and I’ve taught data analysis (Management Information Services) to countless students and also teach local weekend classes over years.
I’m very fortunate to enjoy the MIS and RPA work that I do, my passion is helping people to learn and apply data analysis in their working environment.

9.6

Classbaze Grade®

9.8

Freshness

N/A

Popularity

8.9

Material

Platform: Udemy
Video: 1h 58m
Language: English
Next start: On Demand

Classbaze recommendations for you