Classbaze

Disclosure: when you buy through links on our site, we may earn an affiliate commission.

Microsoft Excel – Excel from Beginner to Advanced

Excel with this A to Z Microsoft Excel Course. Microsoft Excel 2013, Excel 2016, Excel 2019 and Microsoft/Office 365
3.3
3.3/5
(193 reviews)
1,951 students
Created by

8.7

Classbaze Grade®

10.0

Freshness

6.2

Popularity

9.2

Material

Create 6 Excel Dashboards - Learn Excel Data Analysis & Data Visualization with Pivot Tables
Platform: Udemy
Video: 5h 19m
Language: English
Next start: On Demand

Best Excel Dashboard classes:

Classbaze Rating

Classbaze Grade®

8.7 / 10

CourseMarks Score® helps students to find the best classes. We aggregate 18 factors, including freshness, student feedback and content diversity.

Freshness

10.0 / 10
This course was last updated on 4/2022.

Course content can become outdated quite quickly. After analysing 71,530 courses, we found that the highest rated courses are updated every year. If a course has not been updated for more than 2 years, you should carefully evaluate the course before enrolling.

Popularity

6.2 / 10
We analyzed factors such as the rating (3.3/5) and the ratio between the number of reviews and the number of students, which is a great signal of student commitment.

New courses are hard to evaluate because there are no or just a few student ratings, but Student Feedback Score helps you find great courses even with fewer reviews.

Material

9.2 / 10
Video Score: 8.4 / 10
The course includes 5h 19m video content. Courses with more videos usually have a higher average rating. We have found that the sweet spot is 16 hours of video, which is long enough to teach a topic comprehensively, but not overwhelming. Courses over 16 hours of video gets the maximum score.
The average video length is 4 hours 42 minutes of 60 Excel Dashboard courses on Udemy.
Detail Score: 9.6 / 10

The top online course contains a detailed description of the course, what you will learn and also a detailed description about the instructor.

Extra Content Score: 9.5 / 10

Tests, exercises, articles and other resources help students to better understand and deepen their understanding of the topic.

This course contains:

0 article.
1 resources.
0 exercise.
0 test.

In this page

About the course

Excel Data Analysis Masterclass with Excel Dashboards – Learn Data Analysis and Data Visualization with Excel Dashboard.
In this course we will cover topics like Excel Data Analysis and Data Visualization with Excel Pivot Tables, Excel Pivot Charts and 6 Interactive and Excel  Dashboard.
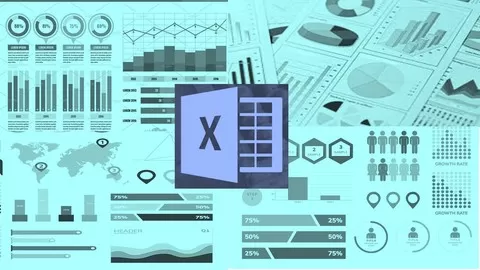
Excel Charts and Excel Graphs are one of most  powerful features of Microsoft Excel which allows the users to represent  numerical data in Graphical Data Visualization format so that end user gets a better view  of the Information discussed.
In this course
You will learn the Excel Pivot Table and Excel Pivot Chart Function in detail and you will learn how to create Dynamic Excel Charts  and Excel Graphs.
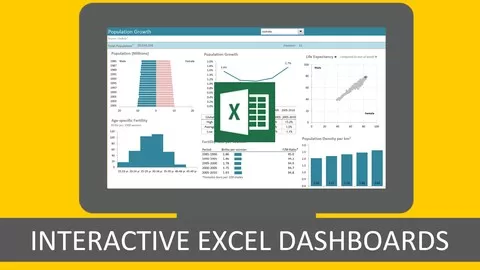
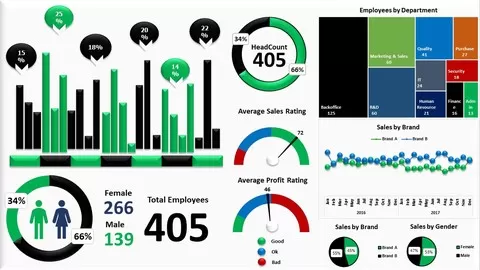
•You will Learn to create 6 Dynamic Sales Dashboards and Report template in Excel
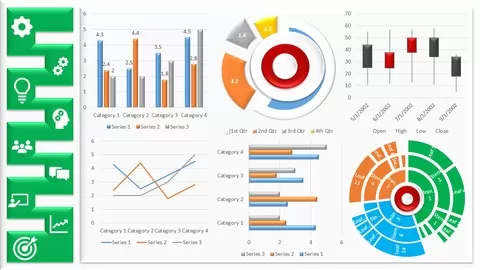
•You will learn how to design, style and format aspects of Excel 2019 are applied on Excel charts
•You will use the dynamic graphical representation to display your complex data in an impressive way.
•Impress management with reports and dashboards that make the decision-making process faster
•Actionable Excel Tips which  you can use now to Create Eye-Catching Microsoft Excel Dashboard
•Use of Excel core functionality for responsive spreadsheets
•Create impressive, non-standard Excel charts using smart techniques
•Build Pivot Table-based interactive dashboards for dynamic usage
This Course is structured in 30 Plus chapters and you will learn all the aspects of Excel Dashboard in depth .
We will go through, steps in detail to create 6 Dynamic Excel Dashboard using Charts,  Design and  Style Elements. You can use either Microsoft Excel 2010, Excel 2013,  Excel 2016 or Excel 2019 for this learning.
Invest In Yourself, Take a decision Today, Start Learning Data Analysis
So Let the Show begin!

What can you learn from this course?

✓ You will learn to create 6 Dynamic Excel Dashboard
✓ You will learn about Pivot Tables and Pivot Chart
✓ You will learn how to Design, Format and Style Data Elements
✓ Learn the Concepts of How to Create and Design an Interactive Excel Dashboard for your department.
✓ Learn Data Analysis using Excel Advanced Formulas
✓ Microsoft Excel Data Analysis with Excel Pivot Tables
✓ Microsoft Excel Data Visualization, Excel Charts & Graphs
✓ Microsoft Excel Data Analysis and Dashboard Reporting

What you need to start the course?

• Basic Excel Knowledge
• This Course is created on Excel 2016, You can also use Excel 2010 and above
• Interest to Learn and Upgrade Your Skillset
• A Windows PC where Microsoft Excel is Installed

Who is this course is made for?

• If you are looking to improve your Microsoft Excel Skills
• If you want to learn how to create Excel Charts, Formulas and Functions and Excel Shortcuts
• If you want to learn foundation of how to create Excel Dynamic Dashboards
• If you create Management Reports or MIS
• Excel users who have basic skills but would like to become more proficient in data exploration and analysis
• Anyone who works with Excel on a regular basis
• If you want to learn data analysis

Are there coupons or discounts for Microsoft Excel - Excel from Beginner to Advanced ? What is the current price?

The course costs $18.99. And currently there is a 83% discount on the original price of the course, which was $109.99. So you save $91 if you enroll the course now.
The average price is $19.4 of 60 Excel Dashboard courses. So this course is 2% cheaper than the average Excel Dashboard course on Udemy.

Will I be refunded if I'm not satisfied with the Microsoft Excel - Excel from Beginner to Advanced course?

YES, Microsoft Excel – Excel from Beginner to Advanced has a 30-day money back guarantee. The 30-day refund policy is designed to allow students to study without risk.

Are there any financial aid for this course?

Currently we could not find a scholarship for the Microsoft Excel - Excel from Beginner to Advanced course, but there is a $91 discount from the original price ($109.99). So the current price is just $18.99.

Who will teach this course? Can I trust Skills On Demand?

Skills On Demand has created 12 courses that got 778 reviews which are generally positive. Skills On Demand has taught 22,583 students and received a 4.1 average review out of 778 reviews. Depending on the information available, we think that Skills On Demand is an instructor that you can trust.
Better Skills Better Learning
Skills on Demand  is an Online Training Startup focused to provide technical training in subject like Programming, Office Productivity and Visual Creativity.
Whether you’re trying to learn a new skill from scratch, or want to refresh your memory on something you’ve learned in the past, you’ve come to the right place.
Join our classes on Udemy to upgrade your skill set at the right place, right time convenient for you as we offer stress free E-Learning.
Our courses can be watched 24/7 wherever you are. Most are fully downloadable so you can take them with you. You can also view them on mobile devices with the Udemy mobile app.
All courses have a 30-day money-back guarantee so that you can check it out, make sure it’s the right course for you, and get a refund if it’s not!
Thank You
SkillsOnDemand
Browse all courses by on Classbaze.

8.7

Classbaze Grade®

10.0

Freshness

6.2

Popularity

9.2

Material

Platform: Udemy
Video: 5h 19m
Language: English
Next start: On Demand

Classbaze recommendations for you