
Description
**** Life time access to course materials. 100% money back guarantee ****
Companies are gathering more and more data everyday. Skills in data analysis, Business Intelligence / Business Analytics are highly in demand in today’s job market. Microsoft Power BI is an advanced yet easy to use self service Business Intelligence / Business Analytics tool for that. It is same B.I. tools used by professional analysts and data scientists.
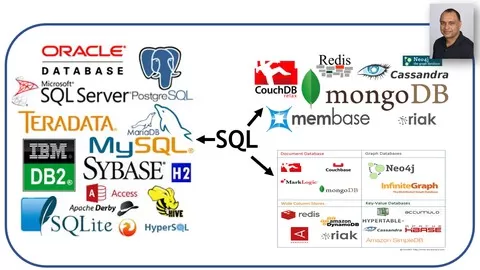
In this course together we will go over business scenarios where you will learn, how to use Power BI and advanced / complex DAX calculations further to derive more insights from data. We are using SQL Server Adventure Works Data warehouse as a sample database. We will hold your hand and walk you thru each scenario Step-by-step.
Not only you will learn Power BI Best Practices, Tip, Tricks and Case Studies that you won’t find in ANY other course but also learn Microsoft’s Popular Course DASHBOARD-IN-A-DAY at your own pace at home or at your office AS A BONUS. All of the exercises are designed by keeping the practical aspects of Power BI and DAX in mind. All exercises are 100% hands-on.
25+ hours of HD videos of building Business Scenarios using DAX and 10 interactive Business Intelligence Reports and Dashboards from scratch to finish. Files for Start and Finished projects also included to challenge you so you can learn by immediately applying what you’re learning . You will have gained the knowledge and confidence to apply these same concepts to real-word to solve the Business problems or Business requirements.
By the time you complete this course, You’ll be a highly proficient in DAX and Power BI user. You’ll be fully prepared to collect, clean, model and present data for any purpose. You will be using your skills as a Business Intelligence Professional to extract knowledge from data so you can analyze and visualize complex Business Problems/Requirements with ease.
Why should you consider a career as a Business Data Analyst?
•Salary. A Business Data Analyst is a well-paid career
•Stable Career. As most corporations gathering more and more data. There will never be shortage of Jobs for Business Data Analyst.
•Advancement in Career : Since you will be building different reports for different departments. You will never be bored and always be valued. Which will bring you more opportunities in your career. Business Data Analyst get very visibility in corporations. Whole management depends on them.
#microsoft #powerbi #data #business #intelligence #analysis #DAX
We are covering the following in this course.
Section 1: Advanced Microsoft Power BI Introduction
•Advanced Microsoft Power BI Course Introduction
•Why Microsoft Power BI
•Microsoft Power BI Family
•Microsoft Power BI Desktop
•Microsoft Power BI Service (Cloud) 1
•Microsoft Power BI Service (Cloud) 2
•What is Descriptive, Predictive and Prescriptive Analytics
•How to take the quizzes
Section 2: Advanced Microsoft Power BI – Collect , In-jest and Import Data
•Import Data from CSV files in Microsoft
•Import Data from Excel files in Microsoft Power BI Desktop
•Import Real-time Streaming Data in Microsoft Power BI Service (Cloud)
•Import Data from OData Feed REST-API in
•Microsoft Power BI Desktop
•Import Data from Folders in Microsoft Power BI Desktop
Section 3: Download and Install SQL Server and Sample Databases
•Download and Install SQL Server
•Download and Install Sample Database
•Import Data from SQL Server in Microsoft Power BI Desktop
Section 4: Introduction to Power BI Dataflows
•Power BI Dataflows – Introduction
•Power BI Dataflows – Create Gateway from Scratch
•Power BI Dataflows – Create Entities from CSV file
•Power BI Dataflows – Create Entities using SQL Server
Section 5: Introduction to Data Modeling
•Modeling Basics 0
•Modeling Basics 1
•Modeling Basics 2
•Modeling and Relationships 0
•Modeling and Relationships 1
•Other ways to create Relationships
•Normalization – Denationalization 0
•Normalization – Denationalization 1
•OLTP vs OLAP
•Star Schema vs Snowflake Schema 0
•Star Schema vs Snowflake Schema 1
Section 6: DAX Basics
•DAX Basics – Importing Data for Dax Learning
•DAX Basics – Resources for Dax Learning
•DAX Basics – What is Dax
•DAX Basics – Dax Data Types
•DAX Basics – DAX Operators and Syntax
•DAX Basics – M vs Dax
•DAX Basics – Create a Column
•DAX Basics – Rules to Create Measures
•DAX Basics – Calculated Columns vs Calculated Measures-0
•DAX Basics – Calculated Columns vs Calculated Measures-1
•DAX Basics – Sum()
•DAX Basics – AVERAGE()-MIN()-MAX()
•DAX Basics – SUMX()
•DAX Basics – DIVIDE()
•DAX Basics – COUNT()-COUNTROWS()
•DAX Basics – CALCULATE()-0
•DAX Basics – CALCULATE()-1
•DAX Basics – FILTER()
•DAX Basics – ALL()
Section 7: Hands-on Real-word Projects
•Procurement Spend Analysis
•Products Analysis
•Regional Analysis
•IT Tickets Analysis
•Human Resources Analysis 1
•Human Resources Analysis 2
•Human Resources Analysis 3
•Financial Analysis
•Sales/Marketing Analysis
•Bank Demographic Report
Section 8: Personal – Enterprise Gateway On-Premises Gateway
•Personal vs Enterprise Gateway
•Install and Configure Personal Gateway
•Install and Configure Enterprise Gateway
•Manage SQL Server Data Source thru Enterprise Gateway
Section 9: Advanced Time-Intelligence
•Create Date Table in DAX-0
•Create Date Table in DAX-1
•Dax Date Code
•Create Date Table in M (important) 11min
•Date Table Code in M
•How to use PREVIOUS Function
•How to use SAMEPERIODLASTYEAR Function
•How to calculate Cumulative or Running totals TOTALXXX()
•How to use DATEADD Function
•How to add column DateLastPurchase in Customer Table
•How to calculate Days to Ship and Delivery Status
•How to calculate Spring-Summer-Autumn-Winter Sales for 2012
•How to Calculate Customer Age and use it in charts and graphs
•How to calculate Days till last purchase
•How to calculate Month-Over-Month values
•How to calculate Previous Week Sales
•How to calculate Running Total 1
•How to calculate Running Total 2
•How to calculate sales for last N days
•How to calculate Weekend – Weekday sales 1
•How to calculate Weekend – Weekday sales 2
•How to calculate Year-Over-Year Growth
•How to calculate Year-To-Date with Different Fiscal Year
•How to Calulate Thanksgiving-BlackFriday-CyberMonday 2 we…
•How to compare Quarter over Quarter 01
•How to compare Quarter over Quarter 02
•How to compare Years-Quarters-Month better way
•How to create Short Month Name for Fiscal Year
•How to do Grouping and Segmenting 1
•How to do Grouping and Segmenting 2
•How to use specific relationships if you have more than 1 relationship
•DAX – Quick Measures
•Display Last Refresh Date
Section 10: Advanced Scenarios
•Create new table for Scenarios Measures
•How to calculate number of order per customers
•How to add calculated column in Employee table
•How to add calculated column in Resellers table
•How to calculate Customers (using TOPN) for Target Marketing
•How to calculate and display Profit Margins
•How to calculate and display sales growth
•How to calculate how many items bought by Customers Multple times
•How to calculate how many Resellers sold specific Item more than 5 times
•How to calculate Moving Average 1
•How to calculate Moving Average 2
•How to calculate number of Products – Customers Sales Trend
•How to calculate Profit or Margin Variance Month-Over-Month
•How to calculate Trend on Profit for Internet Sales
•How to categorize Employees on Sales
•How to categorize Re-sellers
•How to create Product Segment
•How to export measures from Power BI file
•How to see top N Products 01 Statically
•How to see top N Products 02 Dynamically
•How to calculate and show Profits
•How to calculate Best Product Sales Day
•How to calculate Dynamic TOPN product or Customers
•How to calculate Hot Selling Products
•How to calculate how many unique Customers bought specific Product
•How to calculate how many unique Products bought by each Customer
•How to calculate product sales growth
•How to calculate Re-seller 01 Sales Growth Year-Over-Year
•How to calculate Re-seller 02 Sales Growth Year-Over-Year
•How to calculate Revenue Forecast using Analytics Tab
•How to calculate Revenue Forecast using What If Parameter
•How to calculate Top Employees
•How to calculate which Re-seller selling what Products
•How to show Products quantity forecast using Analytics Tab
•How to show Products quantity forecast using using What If Parameter
•How to smooth the trend using Moving Averages
Section 11: Sharing and Collaboration in Power BI
•Sharing and Collaboration
•Sharing Dashboards
•Sharing Workspaces
•Sharing Apps
•Publish to web
Section 12: Bonus – Power BI Best Practices
•Power BI Best Practices 0
•Power BI Best Practices 1
•Power BI Best Practices 2
•Power BI Best Practices 3
•Power BI Best Practices 4
•Power BI Best Practices 5
Section 13: Bonus – Dashboard-in-a-day (Same as actual Microsoft class)
•Power BI Dashboard-in-a-day class 0 – Introduction
•Power BI Dashboard-in-a-day class 1 – Accessing Data
•Power BI Dashboard-in-a-day class 2 – Data Preparation
•Power BI Dashboard-in-a-day class 3 – Data Preparation
•Power BI Dashboard-in-a-day class 4 – Modeling and Data Exploration
•Power BI Dashboard-in-a-day class 5 – Modeling and Data Exploration
•Power BI Dashboard-in-a-day class 6 – Modeling and Data Exploration
•Power BI Dashboard-in-a-day class 7 – Modeling and Data Exploration
•Power BI Dashboard-in-a-day class 8 – Modeling and Data Exploration
•Power BI Dashboard-in-a-day class 9 – Visualization
•Power BI Dashboard-in-a-day class 10 – Visualization
•Power BI Dashboard-in-a-day class 11 – Publishing Report
•Power BI Dashboard-in-a-day class 12 – Creating Dashboards
•Power BI Dashboard-in-a-day class 13 – Creating Dashboards
•Power BI Dashboard-in-a-day class 14 – Creating Dashboards
Best Regards
Biztics Team