
You will play with different datasets and draw beautiful graphs with Tableau, telling wonderful stories with hidden information in data. You will learn the advantages and disadvantages of each graph, draw geo graphical maps easily with Tableau. Extract key features in your dataset. Find business insights and present your business ideas with data driven decisions.
Get Started Today!
Working with Tableau isn’t just lucrative – it’s fun! And unlike most data analysis tools, Tableau uses a drag-and-drop interface, so you don’t need to be a programmer to learn Tableau. If you can learn Excel then you can learn Tableau.
Learn and Apply Fundamental Skills
Get a step-by-step walk-through of the fundamentals of data visualization and data discovery with Tableau. You’ll learn how to:
•Sort, filter, and group your data
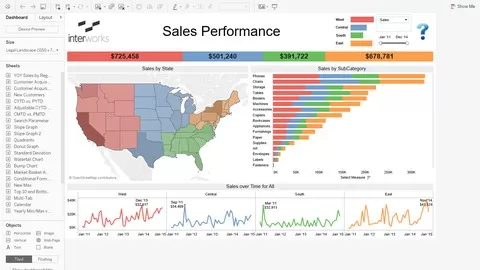
•Create tables, bar charts, line charts
•Show location using geographic maps
•Aggregate with sum, average, min, max, and counts
•Create new fields using calculations
•Combine data using joins and blends
But just watching the videos won’t make you an expert. For mastery, you need to go hands-on by answering questions that reinforce the skills from the videos. To go hands-on, you’ll install the Public version of the Tableau software, which is available for free and easy to install on Mac or Windows. Then you’ll download the sample data set included with the course, and Tableau to answer questions about this sample data.