Classbaze

Disclosure: when you buy through links on our site, we may earn an affiliate commission.

The Power Pivot, Power Query in Excel and Power BI Bundle

Learn how to analyze millions of rows of data in Excel and Power BI in this two-course bundle
4.5
4.5/5
(178 reviews)
1,075 students
Created by

9.6

Classbaze Grade®

9.7

Freshness

9.0

Popularity

9.6

Material

Learn how to analyze millions of rows of data in Excel and Power BI in this two-course bundle
Platform: Udemy
Video: 7h 55m
Language: English
Next start: On Demand

Best Microsoft Power BI classes:

Classbaze Rating

Classbaze Grade®

9.6 / 10

CourseMarks Score® helps students to find the best classes. We aggregate 18 factors, including freshness, student feedback and content diversity.

Freshness

9.7 / 10
This course was last updated on 1/2022.

Course content can become outdated quite quickly. After analysing 71,530 courses, we found that the highest rated courses are updated every year. If a course has not been updated for more than 2 years, you should carefully evaluate the course before enrolling.

Popularity

9.0 / 10
We analyzed factors such as the rating (4.5/5) and the ratio between the number of reviews and the number of students, which is a great signal of student commitment.

New courses are hard to evaluate because there are no or just a few student ratings, but Student Feedback Score helps you find great courses even with fewer reviews.

Material

9.6 / 10
Video Score: 8.8 / 10
The course includes 7h 55m video content. Courses with more videos usually have a higher average rating. We have found that the sweet spot is 16 hours of video, which is long enough to teach a topic comprehensively, but not overwhelming. Courses over 16 hours of video gets the maximum score.
The average video length is 4 hours 56 minutes of 171 Microsoft Power BI courses on Udemy.
Detail Score: 10.0 / 10

The top online course contains a detailed description of the course, what you will learn and also a detailed description about the instructor.

Extra Content Score: 9.9 / 10

Tests, exercises, articles and other resources help students to better understand and deepen their understanding of the topic.

This course contains:

4 articles.
4 resources.
0 exercise.
0 test.

In this page

About the course

**This course includes practice exercise files**
Learn Microsoft Power BI and Power Pivot, Power Query and DAX in Excel in this two-course bundle from Microsoft experts Simon Sez IT.

We’ve combined two of our best data analysis courses to create this huge-value bundle. If you have reached your limit in Excel and you need to analyze and make sense of huge amounts of data, then you need Power Pivot, Power Query and Power BI. These tools can help you take your existing data-crunching capabilities to new heights!

Power Pivot, Power Query and DAX
In this advanced Excel course, we look at three crucial advanced Excel features Power Pivot, Power Query, and DAX. This suite of Excel functions allows you to manipulate, analyze, and evaluate millions of rows of data from Excel or other databases.
We first look at how to bring your data together, merge, and clean it using Power Query before moving onto creating relationships between our data tables and building out a data model. We then look at performing calculations on our data model using DAX, and finally, we look at displaying our analysis using PivotTables and PivotCharts.
***Exercise and demo files included***
In the Power Pivot, Power Query & DAX course you will learn:
•How to get started with Power Query
•How to connect Excel to multiple workbooks
•How to get data from the web and other sources
•How to merge and append queries using Power Query
•How the Power Pivot window works
•How to set up and manage relationships in a data model
•How to create a PivotTable to display your data from the Power Pivot data model
•How to add calculated columns using DAX
•How to use functions such as CALCULATE, DIVIDE, DATESYTD in DAX
•All about creating Pivot Charts and PivotTables and using your data model
•How to use slicers to adjust the data you display

Power BI
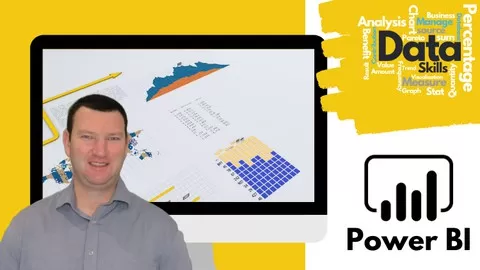
Power BI is an incredibly powerful, self-service Business Intelligence (BI) solution from Microsoft. It is the perfect Business Intelligence tool for people with limited technical experience.
In this Power BI course, we start by looking at Power Query, and how to use this tool to organize and clean our data. We then show you how to build a Data Model and relate separate tables. After that, we teach you all about the data analysis language DAX in Power BI. Finally, we look at how to present this data using the charts and graphs available.
In the Power BI course you will learn:
•What is Power BI and why you should be using it.
•To import CSV and Excel files into Power BI Desktop.
•How to use Merge Queries to fetch data from other queries.
•How to create relationships between the different tables of the data model.
•All about DAX including using the COUTROWS, CALCULATE, and SAMEPERIODLASTYEAR functions.
•All about using the card visual to create summary information.
•How to use other visuals such as clustered column charts, maps, and trend graphs.
•How to use Slicers to filter your reports.
•How to use themes to format your reports quickly and consistently.
•How to edit the interactions between your visualizations and filter at visualization, page, and report level.

***Exercise files included***
This course includes:
•7+ hours of video tutorials
•89 individual video lectures
•Exercise files to practice what you learned
•Certificate of completion

Here’s what our students are saying…

“Very detailed course, really enjoyed the Power BI section. Simon has done a really good job explaining each process step. Looking forward to completing additional Power BI courses for advance techniques.”
– Martin
“Brilliant course. I’m quite new to the world of POWER and this course has shown me what it can do in a way that a newbie can understand. Recommended. I will be looking for other courses by them.”
– Andrew
“Extremely clear instructions and has framed the subject matter as usable in the real world as opposed to just an academic sample. I was exposed to Power Pivot in one of my classes in college but it was presented in a way that made it difficult to apply to my work. Glad I found this course!”
– Jeff
“The best course where you can get the knowledge from Advance Excel to Power Bi. Highly recommended for Excel data analyst.”
– Sabari
What can you learn from this course?

✓ Learn to unlock advanced Excel tools Power Query and Power Pivot as well as Power BI in this two-course bundle!
✓ Analyze huge buckets of data to make informed business decisions
✓ Become confident cleaning, sorting and linking data from various sources
✓ Learn via expert instruction and exercises designed to have you performing complex analysis
✓ How to create stunning, interactive dashboards with Power BI
✓ How to share your analysis and dashboards using Power BI Online
✓ To import CSV and Excel files into Power BI Desktop
✓ All about DAX including using the COUTROWS, CALCULATE, and SAMEPERIODLASTYEAR functions
✓ All about using the card visual to create summary information
✓ How to create amazing visuals, such as clustered column charts, maps, and trend graphs
✓ How to use Slicers to filter your reports
✓ How to edit the interactions between your visualizations and filter at visualization, page, and report level

What you need to start the course?

• You’ll need a copy of Microsoft Excel that is compatible with the Power Pivot tool.
• A good understanding of MS Excel. This is an advanced level course.
• Power BI Desktop installed on your machine is required to take the practice exercises
• A good knowledge of MS Excel is advised but not necessary

Who is this course is made for?

• Advanced Excel Users

Are there coupons or discounts for The Power Pivot, Power Query in Excel and Power BI Bundle ? What is the current price?

The course costs $17.99. And currently there is a 82% discount on the original price of the course, which was $99.99. So you save $82 if you enroll the course now.
The average price is $16.2 of 171 Microsoft Power BI courses. So this course is 11% more expensive than the average Microsoft Power BI course on Udemy.

Will I be refunded if I'm not satisfied with the The Power Pivot, Power Query in Excel and Power BI Bundle course?

YES, The Power Pivot, Power Query in Excel and Power BI Bundle has a 30-day money back guarantee. The 30-day refund policy is designed to allow students to study without risk.

Are there any financial aid for this course?

Currently we could not find a scholarship for the The Power Pivot, Power Query in Excel and Power BI Bundle course, but there is a $82 discount from the original price ($99.99). So the current price is just $17.99.

Who will teach this course? Can I trust Simon Sez IT?

Simon Sez IT has created 192 courses that got 76,669 reviews which are generally positive. Simon Sez IT has taught 587,307 students and received a 4.5 average review out of 76,669 reviews. Depending on the information available, we think that Simon Sez IT is an instructor that you can trust.
575000+ Students | Wordwide Use 183 Countries | 190+ Courses
Since 2008, individuals, small businesses, and Fortune 500 companies with thousands of employees have benefited from the easy and hands-on software training offered by Simon Sez IT. With over 8,000 video tutorials on a range of software programs, Simon Sez IT ensures stress-free eLearning and enhanced employee productivity – no matter whether you are implementing new software or a technological upgrade for your workplace. With over 575,000 Udemy students in over 180 countries, Simon Sez IT is the preferred online learning choice for individuals and businesses everywhere. 
Browse all courses by on Classbaze.

9.6

Classbaze Grade®

9.7

Freshness

9.0

Popularity

9.6

Material

Platform: Udemy
Video: 7h 55m
Language: English
Next start: On Demand

Classbaze recommendations for you