
This introduction in Data Visualization will introduce you to Tableau! Tableau is the data visualisation platform that thousands of companies use today! This short course will allow you to jump into data visualization with a hands-on exercise about analyzing Trump’s Twitter Feed!
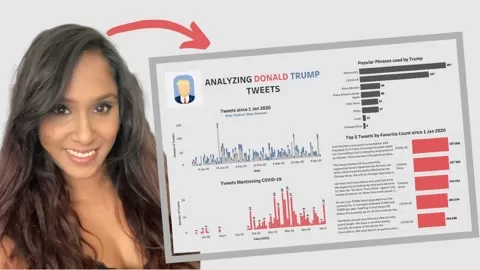
You’ll learn to create a dashboard like the one below!
You’ll learn all of the features in Tableau that will offer as a good introduction to Data Visualization. It will allow you to explore, experiment, fix, prepare, and present data easily, and beautifully.
By the end of this class, you will learn:
- Create and format charts
- Create a dashboard your user can interact with drill down for more detail
- Create calculated fields
- Use logic statements
- Use Tableau functions such as CONTAINS
- Creating Data Extracts in Tableau
- Filtering data
- Creating Sets
This course begins with the Tableau basics. You will navigate the software, connect it to a data file, and build a functional dashboard, so beginners will feel completely at ease! It will introduce you to the principals of data visualization to kick start your career in Data Analytics!
Dataset
Want to get updated data? You can access it through this website
View my other class on a more detailed introduction to Tableau and Data Visualization: