Classbaze

Disclosure: when you buy through links on our site, we may earn an affiliate commission.

Excel Charts – Excel Charts and Graphs Basic Training

Learn how to use Excel 2013 to create impressive data visualizations - ExcelChart and Graphs Basic Training
4.4
4.4/5
(885 reviews)
5,651 students
Created by

6.9

Classbaze Grade®

2.7

Freshness

8.7

Popularity

8.8

Material

Learn how to use Excel 2013 to create impressive data visualizations - ExcelChart and Graphs Basic Training
Platform: Udemy
Video: 2h 50m
Language: English
Next start: On Demand

Best Excel Charts classes:

Classbaze Rating

Classbaze Grade®

6.9 / 10

CourseMarks Score® helps students to find the best classes. We aggregate 18 factors, including freshness, student feedback and content diversity.

Freshness

2.7 / 10
This course was last updated on 6/2016.

Course content can become outdated quite quickly. After analysing 71,530 courses, we found that the highest rated courses are updated every year. If a course has not been updated for more than 2 years, you should carefully evaluate the course before enrolling.

Popularity

8.7 / 10
We analyzed factors such as the rating (4.4/5) and the ratio between the number of reviews and the number of students, which is a great signal of student commitment.

New courses are hard to evaluate because there are no or just a few student ratings, but Student Feedback Score helps you find great courses even with fewer reviews.

Material

8.8 / 10
Video Score: 8.0 / 10
The course includes 2h 50m video content. Courses with more videos usually have a higher average rating. We have found that the sweet spot is 16 hours of video, which is long enough to teach a topic comprehensively, but not overwhelming. Courses over 16 hours of video gets the maximum score.
The average video length is 3 hours 20 minutes of 37 Excel Charts courses on Udemy.
Detail Score: 9.0 / 10

The top online course contains a detailed description of the course, what you will learn and also a detailed description about the instructor.

Extra Content Score: 9.5 / 10

Tests, exercises, articles and other resources help students to better understand and deepen their understanding of the topic.

This course contains:

0 article.
2 resources.
0 exercise.
0 test.

In this page

About the course

Do you work with charts but struggle to identify which chart to use?
Are you new to data analysis?
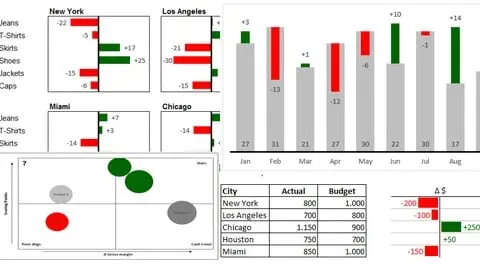
Do you want to learn about the charting options Excel 2013/2010 offers?
Are you looking for a structured way to learn about the Excel charting tools?
If your answer was YES to some of the questions, this course might be of interest to you.
When I created this course I put full emphasis on a structured and didactically sound way to gently show you how data visualization in Excel 2013 works. This course is especially suited towards a beginners audience to data visualization with Excel.
Most of the concepts of this course also apply to Excel 2010, so you might also consider this course if you are on 2010.
Beginners to data analysis often need a clear understanding of which chart type is suitable for a given dataset. I will give you this important knowledge right at the beginning so that you know from the start what you are dealing with and how you can utilize that knowledge.
I will also show you step by step all you need to know about the basic chart formatting tools. You will learn how to add elements, format axes, change colors and so on.
There is also a section about the frequently used types of charts and how you can easily create them in Excel.
At the end of this beginners course you should be confident in using Excel for standard charts. You will be also able to format already existing charts and tailor them in accordance with your needs.
I highly recommend to take a close look at the introductory videos on which type of chart to use for a given circumstance. Only if you know which chart type is suitable for a dataset will you be able to make full use of the many options Excel has to offer.

What can you learn from this course?

✓ create the most common type of charts in Excel
✓ know which chart to use for a given dataset
✓ perform standard format changes in charts
✓ use Excel 2013 confidently for charts and graphs

What you need to start the course?

• Excel 2013 is required – but the previous Excel version has similar features so you might also use your knowledge with the 2010 version
• interest in data visualization
• a basic understanding of charts and graphs

Who is this course is made for?

• Everybody interested in data visualization
• Everybody willing to try out the material at home and solve the exercises
• Everybody starting out to work with Excel
• Everybody needing charts for work or study purposes

Are there coupons or discounts for Excel Charts - Excel Charts and Graphs Basic Training ? What is the current price?

The course costs $14.99. And currently there is a 25% discount on the original price of the course, which was $19.99. So you save $5 if you enroll the course now.
The average price is $14.8 of 37 Excel Charts courses. So this course is 1% more expensive than the average Excel Charts course on Udemy.

Will I be refunded if I'm not satisfied with the Excel Charts - Excel Charts and Graphs Basic Training course?

YES, Excel Charts – Excel Charts and Graphs Basic Training has a 30-day money back guarantee. The 30-day refund policy is designed to allow students to study without risk.

Are there any financial aid for this course?

Currently we could not find a scholarship for the Excel Charts - Excel Charts and Graphs Basic Training course, but there is a $5 discount from the original price ($19.99). So the current price is just $14.99.

Who will teach this course? Can I trust R-Tutorials Training?

R-Tutorials Training has created 24 courses that got 31,105 reviews which are generally positive. R-Tutorials Training has taught 253,639 students and received a 4.4 average review out of 31,105 reviews. Depending on the information available, we think that R-Tutorials Training is an instructor that you can trust.
Data Science Education
  R-Tutorials is your provider of choice when it comes to analytics training courses! Try it out – our 100,000+ students love it. 
        We focus on Data Science tutorials. Offering several R courses for every skill level, we are among Udemy’s top R training provider. On top of that courses on Tableau, Excel and a Data Science career guide are available.
        All of our courses contain exercises to give you the opportunity to try out the material on your own. You will also get downloadable script pdfs to recap the lessons. 
        The courses are taught by our main instructor Martin – trained biostatistician and enthusiastic data scientist / R user. 
        Should you have any questions, you are invited to check out our website, you can open a discussion in the course or you can simply drop us a pm. 
        We are here to help you boost your career with analytics training – Just learn and enjoy. 
Browse all courses by on Classbaze.

6.9

Classbaze Grade®

2.7

Freshness

8.7

Popularity

8.8

Material

Platform: Udemy
Video: 2h 50m
Language: English
Next start: On Demand

Classbaze recommendations for you