Classbaze

Disclosure: when you buy through links on our site, we may earn an affiliate commission.

The Complete Microsoft Excel Pivot Tables and Pivot Charts

Excel Charts, Excel Analytics, Excel Pivot Table , Excel Pivot Charts, Excel Dashboard, Excel Data Analysis & Reporting
4.3
4.3/5
(707 reviews)
78,407 students
Created by

8.9

Classbaze Grade®

9.4

Freshness

7.7

Popularity

9.1

Material

Excel Charts
Platform: Udemy
Video: 2h 28m
Language: English
Next start: On Demand

Best Excel Analytics classes:

Classbaze Rating

Classbaze Grade®

8.9 / 10

CourseMarks Score® helps students to find the best classes. We aggregate 18 factors, including freshness, student feedback and content diversity.

Freshness

9.4 / 10
This course was last updated on 10/2021.

Course content can become outdated quite quickly. After analysing 71,530 courses, we found that the highest rated courses are updated every year. If a course has not been updated for more than 2 years, you should carefully evaluate the course before enrolling.

Popularity

7.7 / 10
We analyzed factors such as the rating (4.3/5) and the ratio between the number of reviews and the number of students, which is a great signal of student commitment.

New courses are hard to evaluate because there are no or just a few student ratings, but Student Feedback Score helps you find great courses even with fewer reviews.

Material

9.1 / 10
Video Score: 7.9 / 10
The course includes 2h 28m video content. Courses with more videos usually have a higher average rating. We have found that the sweet spot is 16 hours of video, which is long enough to teach a topic comprehensively, but not overwhelming. Courses over 16 hours of video gets the maximum score.
The average video length is 5 hours 16 minutes of 49 Excel Analytics courses on Udemy.
Detail Score: 10.0 / 10

The top online course contains a detailed description of the course, what you will learn and also a detailed description about the instructor.

Extra Content Score: 9.5 / 10

Tests, exercises, articles and other resources help students to better understand and deepen their understanding of the topic.

This course contains:

0 article.
6 resources.
0 exercise.
0 test.

In this page

About the course

Recent Student’s Reviews

***Great course with interactive dashboard, pivot charts, pivot table and exercises to help student understand the course – Clark Belle Ortega***

***Very good course! Excellent! It’s definitely one of my favorites – Luis Fernando***

***It Is Very Helpful And Easy To Understand. I Have No Doubts Regarding Pivot Tables And Its Formatting After Going Through It. Thank You For The Wonderful Teaching And Technical Support. – Deepak Kumar Kanaujia***

***Very Detailed Illustration And The Instructor Knows Well How To Use His Tools. Happy To Attend This Course And I Believe I Am Gonna Use It A Lot In My Work. – Mohamed Eltantawi***

***Wonderful Course. I’ve Been Using Excel For Many Years. But, What I’ve Learned In This Course Is A Paradigm Shift. – Yousuf Saif Al Hinai***

***Wow! Its Amazing Pivot Tables Course. I’ve Lots Of Gap On This Topic. Now, I’ve Clear Concept. – Md. Anisur Rahmen***

Nine Reasons why you should choose this The Complete Microsoft Excel Pivot Tables and Pivot Charts Course

•Best Rated Course on Udemy
•You will learn various data analysis techniques using MS Excel
•Latest updated and Doubts Are Solved in this course
•Carefully designed curriculum By Proficient In Microsoft Excel Expert
•you can complete this course In Short time
•Pivot table & Pivot charts related examples and case studies Provided
•06 Examples And  practice exercises Are Able to Download in The Recourse Section
•Your queries will be responded by the Instructor With In Short time
•A Verifiable Certificate will Be Provided On the Completion

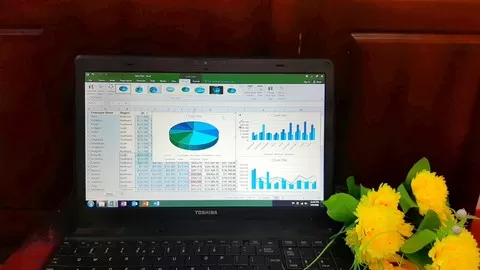
Microsoft Excel’s Pivot table and Pivot charts are  The Powerful Tools to Analysis And Manipulating the data . it helps to Analysis the data in different perspective to take importance and Essential decision making in the organization. The pivot tables and pivot chats help to calculate, summarize the data very quickly. Pivot Tables Allow to see comparisons, patterns, and trends by using our data and it help us easy to analyzing and visualizing data with Microsoft excel in any Kind of Data.
The Course Contents Eight Chapters & The Details As Below.

What is covered in this course?

CHAPTER -01 INTRODUCTION TO PIVOT TABLES & PIVOT CHARTS
•Introduction To Pivot Tables & Pivot Charts
CHAPTER -02 FORMAT DATA FOR PIVOT TABLES IN EXCEL
•Normalize The Data For Pivot Table
•Convert Normal Data To Table
CHAPTER -03 CREATE PIVOT TABLE AND FORMAT VALUES IN EXCEL
•Create The Pivot Table In Excel
•Format Values In Pivot Table
CHAPTER -04 EXPAND AND COLLAPSE PIVOT TABLE IN EXCEL
•Expand And Collapse Pivot Table In Excel
•CHAPTER-05 REPORT FILTER AND REFRESH PIVOT TABLE IN EXCEL
•Report Filter Pivot Table In Excel
•Refresh Pivot Table In Excel
CHAPTER-06 CREATE DYNAMIC DASHBOARD & PIVOT CHARTS FROM PIVOT TABLES
•Create Bar Chart -Clustered Bar
•Create Column Chart -Clustered Column
•Create Pie Chart – Doughnut Chart
•Create Column Chart – 3d Column Chart
•Create Line Chart- Line With Markers Chart
•Insert Slicer
CHAPTER -07 MANAGING PIVOT TABLES
•Connecting To An External Data Source
•Creating A Recommended Pivot Table
•Copy And Move Pivot Tables
•Delete The Pivot Tables
•Clearing & Reapplying Pivot Tables
•Copy The Values Only From Pivot Table
CHAPTER-08 COMPLETE PIVOT TABLES AND PIVOT CHARTS EXERCISES WITH ANSWERS
•Complete Exercises Questions One To Seven
•Complete Exercises Questions Eight To Fourteen
•Complete Exercises Questions Fifteen To Seventeen
Go ahead and click the enroll button, and I’ll see you in Chapter 1!
Cheers
A.M.A.M.Mubeen

What can you learn from this course?

✓ What Is Pivot Table and Pivot Charts and Key Benefit of Pivot Table?
✓ How to Normalize the Data for Pivot Table?
✓ How to Convert Normal Data to Table?
✓ How to Create the Pivot Table in Excel?
✓ How to Format Values in Pivot Table?
✓ How to Expand and Collapse Pivot Table in Excel?
✓ How to Report Filter Pivot Table in Excel?
✓ How to Refresh Pivot Table in Excel?
✓ How to Create Bar Chart by Using Pivot Table?
✓ How to Create Column Chart by Using Pivot Table?
✓ How to Create Pie Chart by Using Pivot Table?
✓ How to Create 3D Column Chart by Using Pivot Table?
✓ How to Create Line Chart by Using Pivot Table?
✓ How to Insert Slicer?
✓ How to Connect to an External Data Source in Excel?
✓ How to Create a Recommended Pivot Table?
✓ How to Copy and Move Pivot Tables?
✓ How to Delete the Pivot Table?
✓ How to Clearing & Reapplying Pivot Table?
✓ How to Copy the Values Only from Pivot Table?

What you need to start the course?

• No prior Excel knowledge is needed
• Installed Microsoft Excel

Who is this course is made for?

• Sales manager
• Students
• Individual
• Accountants
• Auditor
• Financial analyst
• Information clerk

Are there coupons or discounts for The Complete Microsoft Excel Pivot Tables and Pivot Charts ? What is the current price?

The course costs $14.99. And currently there is a 25% discount on the original price of the course, which was $19.99. So you save $5 if you enroll the course now.
The average price is $18.3 of 49 Excel Analytics courses. So this course is 18% cheaper than the average Excel Analytics course on Udemy.

Will I be refunded if I'm not satisfied with the The Complete Microsoft Excel Pivot Tables and Pivot Charts course?

YES, The Complete Microsoft Excel Pivot Tables and Pivot Charts has a 30-day money back guarantee. The 30-day refund policy is designed to allow students to study without risk.

Are there any financial aid for this course?

Currently we could not find a scholarship for the The Complete Microsoft Excel Pivot Tables and Pivot Charts course, but there is a $5 discount from the original price ($19.99). So the current price is just $14.99.

Who will teach this course? Can I trust A.M.A.M Mubeen (Expert In Microsoft Office & Tally & Finance)?

A.M.A.M Mubeen (Expert In Microsoft Office & Tally & Finance) has created 13 courses that got 5,624 reviews which are generally positive. A.M.A.M Mubeen (Expert In Microsoft Office & Tally & Finance) has taught 253,756 students and received a 4.3 average review out of 5,624 reviews. Depending on the information available, we think that A.M.A.M Mubeen (Expert In Microsoft Office & Tally & Finance) is an instructor that you can trust.
250,000+ Students | 4+ Rated | 199+ Countries
I am the Expert in Microsoft Office ,Tally ERP 9,Accounting & Finance Related Subjects and A Degree Holder (Specialization In Finance) , I Was Working in Different Positions Such as Senior Accountant and Financial Manager of Contract Based Company. I Have Been Teaching More Than 5 Years And I Delivered Various Lecture Programs and My All Lecture Programs are Much Dynamics & interesting as well. I Hope That You Will Enjoy My All Courses.

8.9

Classbaze Grade®

9.4

Freshness

7.7

Popularity

9.1

Material

Platform: Udemy
Video: 2h 28m
Language: English
Next start: On Demand

Classbaze recommendations for you